Assessing Power, Kinematic, and Muscle Oxygenation Asymmetries Between Legs During Incremental 400 m Track Running in Triathletes
Jordi Montraveta
Ignacio Fernández-Jarillo
Xavier Iglesias

Diego Chaverri
*Corresponding author: Diego Chaverri dchaverri@gencat.cat
Cite this article
Montraveta, J., Fernández-Jarillo, I., Iglesias, X., & Chaverri, D. (2026). Assessing power, kinematic, and muscle oxygenation asymmetries between legs during incremental 400-m track running in triathletes. Apunts. Educación Física y Deportes, 165, 70-81. https://doi.org/10.5672/apunts.2014-0983.es.2026.165.07
Abstract
Running on a 400-m track may induce asymmetries in power output (PWR), kinematics, or muscle oxygen saturation (SmO2). This study primarily aimed to determine whether 400-m track running induces measurable differences in power output, kinematics, and muscle oxygen saturation between the inner and outer legs. The secondary aim was to evaluate the extent of asymmetries in power output, kinematics, and muscle oxygen saturation in triathletes during track running. PWR and kinematic data were collected using Stryd sensors placed on both shoes, while SmO2 data were obtained via near-infrared spectroscopy (NIRS) devices positioned on the vastus lateralis (VL) muscles of both legs. Although SmO2, PWR, and kinematic parameters showed changes corresponding to increased velocity during the VAM-EVAL test, an incremental running protocol in which speed increases by 0.5 km·h-1 every minute until exhaustion, repeated-measures ANOVA revealed significant main effects of leg (inner vs. outer) for power output (PWR), step length (SL), ground contact time (GCT), and vertical oscillation (VO). However, post hoc analyses identified significant inter-limb differences only for PWR at 80% of maximal aerobic speed (MAS), and for SL at 70% and 80% MAS. Regarding asymmetries, repeated-measures ANOVA showed no significant differences across intensities, except for SmO2, with significant changes observed between 60–90% and 70–90% MAS. These findings highlight the potential of SmO2 asymmetries measured via NIRS to non-invasively detect disparities in oxygen utilization between the legs, particularly at high intensities (90% MAS). This technology could assist athletes and coaches in identifying imbalances in oxygen delivery and utilization between legs, a critical factor for optimizing muscle performance.
Introduction
Running on a 400-m track is fundamental for training and performance assessment, providing a controlled setting for evaluating endurance and kinematic efficiency (Léger & Boucher, 1980). These tracks feature two straight sections (approximately 84.39 m each) and two curved sections with a radius of around 36.5 m (World Athletics, 2019). The curves present unique biomechanical challenges, requiring runners to manage continuous leftward turns. This asymmetrical movement places different mechanical and physiological demands on the inner and outer legs due to variations in loading, with potential implications for performance and injury risk (Alt et al., 2015). Supporting this perspective, Gilgen-Ammann et al. (2017) found that gait asymmetry was significantly greater in runners with a history of injury than in uninjured counterparts, suggesting that persistent asymmetries may reflect underlying vulnerabilities. This raises the question of whether pre-existing asymmetries may be the reason for these injuries (Knapik et al., 1991; Vasquez-Bonilla et al., 2022, 2023).
To better understand the origin of these asymmetries, it is essential to examine how curved-track running affects specific kinematic variables such as cadence (CAD), stride length (SL), and ground contact time (GCT). In response to the centrifugal forces generated during turning, athletes typically exhibit a shorter SL and longer GCT in the inner leg compared with the outer leg, particularly at higher running speeds. The inner leg serves as a stabilizer under increased compressive forces, while the outer leg provides greater propulsion to meet the biomechanical demands of the curve (Chang & Kram, 2007). In the study by Chang and Kram (2007), asymmetries between the inner and outer legs were observed during sprinting on a 6-m radius curve. The outer leg demonstrated a significantly greater SL compared to the inner leg (1.70 ± 0.10 m vs. 1.53 ± 0.02 m; p < .05). Although differences were also noted in step frequency (SF) (3.88 ± 0.13 steps s⁻¹ vs. 3.56 ± 0.12 steps s⁻¹) and GCT (0.203 ± 0.008 s vs. 0.190 ± 0.006 s), these differences were not statistically significant. Hamill et al. (1987) investigated how runners adjusted lower-extremity function when navigating the curves of a 400-m track. Their study revealed significant asymmetries between the right and left limbs during curved running, particularly in the initial phase of foot contact. Notably, differences were observed in touchdown angles, maximum pronation angles, and mediolateral ground reaction forces. These findings suggest that transitions between curved and straight sections of the track require runners to adapt their gait patterns dynamically. Continuous leftward turning on curves imposes distinct mechanical and physiological demands on each leg, potentially affecting variables such as vertical oscillation (VO) and CAD (Hamill et al., 1987).
Over time, these asymmetrical mechanical loads may contribute to the development of inter-limb asymmetries, particularly in athletes who frequently train on curved tracks. This concept refers to performance imbalances between the opposing limbs of the body (Bishop et al., 2017, 2022; Fox et al., 2023). Although inter-limb asymmetries have traditionally been studied in multidirectional sports involving explosive actions and rapid changes of direction (Bishop et al., 2017; Loturco et al., 2019), recent research has also examined these imbalances in endurance-based and linear disciplines such as running and triathlon (Helme et al., 2021; D’Hondt et al., 2024; Jacques et al., 2021). These findings suggest that asymmetries are relevant not only in team sports but also in activities characterized by continuous and repetitive motion. Asymmetries in lean mass distribution, muscle strength, or power output (PWR) have been linked to performance inefficiencies and an increased risk of injury (Bell et al., 2014; Knapik et al., 1991).
Systematic reviews have underscored the complex relationship between inter-limb asymmetry and sports performance. For example, Bishop et al. (2017) concluded that inter-limb asymmetries observed across a variety of tasks often have a negative impact on physical performance. However, their findings highlighted significant variability, with some studies reporting minimal or no association between asymmetry and performance outcomes. Similarly, D’Hondt et al. (2024) reported high methodological heterogeneity in studies on inter-limb asymmetry and endurance running, making it difficult to draw definitive conclusions. Although some asymmetry metrics, such as unilateral countermovement jump (UCMJ) asymmetries exceeding 10% or inter-limb differences in strength, may negatively affect running performance (Bishop et al., 2017), the evidence is not universally consistent, emphasizing the need for high-quality research to determine thresholds and actionable training implications.
In triathlon, kinematic asymmetries may be more strongly influenced by the prolonged and repetitive mechanical demands of cycling than by the transition itself. Accumulated fatigue from cycling can alter neuromuscular control during subsequent running, potentially exacerbating inter-limb asymmetries (Millet & Vleck, 2000). Heiden and Burnett (2003) demonstrated that muscle activation patterns in the legs during running are significantly altered following the cycling segment, with notable changes in key lower-limb muscles such as the biceps femoris and vastus lateralis. Similarly, Connick and Li (2015) reported increased stride-time variability and reduced stride length during post-cycling running, indicating a disruption in locomotor control likely linked to prior fatigue. Olcina et al. (2019) observed a decrease in stride length following cycling, suggesting impaired neuromuscular recruitment as a contributing factor.
In addition to kinematic and muscle activation variables, muscle physiology parameters are also relevant for better understanding limb asymmetries. Muscle oxygen saturation (SmO₂) provides valuable information for assessing potential inter-limb differences. A decrease in SmO₂ reflects a greater imbalance between oxygen delivery and utilization, indicating increased muscular oxygen extraction during exercise (van der Zwaard et al., 2016). Using near-infrared spectroscopy (NIRS), researchers have been able to evaluate whether variability or asymmetries in oxygen utilization exist between the legs during activities such as cycling (Sendra-Pérez et al., 2025; Skotzke et al., 2024). Olcina et al. (2019) examined the effect of prior cycling on running performance, stride length, and muscle oxygen saturation (SmO₂) in triathletes, and their results indicated that high-intensity cycling before running can impair performance by reducing stride length and limiting the peripheral utilization of oxygen in muscles exhibiting elevated SmO₂ levels. These findings suggest that pre-fatigue induced by cycling not only compromises biomechanical efficiency but also leads to localized oxygenation imbalances, potentially exacerbating muscle asymmetries during the subsequent running segment. Similar findings have been reported in other sports such as football and rugby, where SmO₂ asymmetries correlate with reduced performance efficiency and increased injury risk (Vasquez-Bonilla et al., 2022, 2023).
Wearable technology now allows real-time monitoring of kinematic variables, PWR, and SmO₂ to assess asymmetries. Devices such as the Stryd sensor provide detailed data on PWR, SL, GCT, and VO, supporting performance analysis (van Rassel et al., 2023). These tools help athletes and coaches identify inter-limb differences in mechanical output and SmO₂, enabling targeted training to optimize performance and reduce injury risk. Prior studies have demonstrated their usefulness in this context. For example, Bini and Hume (2015) found notable pedal-force asymmetries during cycling time trials, whereas Yanci (2014) reported PWR asymmetries between dominant and nondominant legs in endurance athletes. Both studies suggest that addressing these imbalances may enhance performance and reduce injury risk.
Building on this foundation, inter-limb asymmetry is defined as the imbalance or difference between the lower limbs which can manifest in functional, kinematic, or kinetic dimensions. In endurance runners, research has reported functional asymmetries of approximately 16–17% and biomechanical differences ranging from 3% to 54%, depending on the task and metric used (D’Hondt et al., 2024). While data specifically quantifying its general prevalence in triathletes remain scarce due to a lack of prior investigations in this population, existing evidence has documented significant lateral differences in neuromuscular characteristics. Specifically, running after cycling has been shown to alter muscle activation patterns, such as reduced soleus activation in one limb, despite no observed differences in external kinetics or kinematics (Jacques et al., 2021). Given the biomechanical demands of track running and the documented presence of inter-limb asymmetries in endurance athletes and triathletes, this study aimed to address the following objectives:
To analyze whether running on a 400-m track induces measurable differences in power, kinematics, and muscle oxygen saturation between the inner and outer legs.
To evaluate the extent of power, kinematic, and muscle oxygen saturation asymmetries in triathletes during track running.
Materials and Methods
Participants
Fourteen national-level male triathletes voluntarily participated in this study (Table 1). Inclusion criteria were being licensed and actively competing in national triathlon events. Exclusion criteria included cardiac disorders, current injury, or injury within the previous two months. Furthermore, individuals with an adipose tissue thickness (ATT) greater than 7 mm were excluded to minimize interference with NIRS signal quality, as higher ATT can attenuate near-infrared light and compromise the accuracy of SmO₂ readings (McManus et al., 2018). ATT was calculated as 0.5 × the mean skinfold thickness. All participants provided written informed consent, and the study protocol was approved by the Clinical Research Ethics Committee of the Catalan Sports Administration (026/CEICGC/2023).

Materials
PWR and kinematic parameters were measured using the Stryd sensor (Stryd Inc., Boulder, CO, USA), which has been previously validated for running power estimation under controlled conditions (Cerezuela-Espejo et al., 2021). Stryd sensors were attached to the laces of each running shoe, centrally positioned on the dorsum of the foot, in accordance with the manufacturer’s guidelines. The device sampled and exported processed data at 1 Hz, while internal inertial data were recorded at higher rates (up to ~100 Hz). SmO2 was measured with a continuous-wave NIRS device (MOXY, Hutchinson, Minnesota, United States) using four wavelengths (680, 720, 760, and 800 nm). SmO2 was measured as a percentage according to the following equation: SmO2 = [oxy. hemoglobin (O2Hb) / (oxy. hemoglobin (O2Hb) + deoxy. Hemoglobin (HHb))] * 100 where O₂Hb represents oxyhemoglobin and HHb represents deoxyhemoglobin. The MOXY device is a portable, non-invasive NIRS system designed for field-based assessments of muscle oxygenation. Its validity and reliability for measuring SmO₂ during exercise have previously been established (Feldmann et al., 2019). The NIRS device was positioned over the belly of the vastus lateralis (VL) muscle on both legs, midway between the greater trochanter and the lateral femoral epicondyle (McManus et al., 2018). The sensors were secured with adhesive tape (Hypafix; BSN Medical, Hamburg, Germany). The sampling rate was set to the device’s default mode, updating every two seconds with a 10-second smoothing window.
Procedures
The placement of the Moxy sensors was determined using a tape measure and a marker pen. In addition, skinfold thickness was measured at the site where the NIRS device was positioned using a Harpenden skinfold caliper (accuracy: 0.20 mm). The Stryd sensors were then attached to both running shoes.
All participants performed a VAM-EVAL test (García & Secchi, 2013) on a 400-m track.In accordance with the original protocol, no standardized warm-up was performed prior to testing, as the low initial running speed provided a progressive warm-up.Running speed was controlled by an acoustic signal. The initial velocity was set at 8.5 km·h⁻¹ and increased by 0.5 km·h⁻¹ each minute. Cones were placed every 20 m to help participants adjust their pace to the audio cues. The test was terminated when participants stopped due to exhaustion or failed to reach the marked cone on two consecutive occasions. Maximal aerobic speed (MAS) was defined as the velocity achieved during the last fully completed stage; incomplete stages were not considered (García & Secchi, 2013).
The testing sessions were conducted on an outdoor athletics’ track in Barcelona between February 27 and April 23, 2024, under average environmental conditions of 21.1 ± 5.7 °C and 74.6 ± 16.6% relative humidity. Participants were instructed to refrain from high-volume or high-intensity training during the 24 hours preceding the test.
Statistical Analysis
Kinematic and SmO₂ data were filtered every 2 seconds before analysis and temporally aligned to time zero (t = 0) for synchronization. Time zero was defined as the start of the VAM-EVAL test, identified by the first increase in running speed indicated by the acoustic signal, and synchronized across devices using the internal timestamps of the recording systems. Descriptive statistics (mean ± standard deviation [SD]) were calculated for all variables.
The intensity levels (60%, 70%, 80%, and 90% of maximal aerobic speed [MAS]) were determined from the results of the VAM-EVAL test. Mean values for both legs were obtained from the central 20 seconds of each one-minute interval at every intensity level.
Normality was evaluated using the Shapiro–Wilk test. With the exception of some asymmetry indices (PWR ASYM, CAD ASYM, VO ASYM, GCT ASYM, and SL ASYM), all variables met the assumption of normality. Consequently, a two-way repeated-measures analysis of variance (ANOVA) was conducted to compare differences between legs (inner leg vs. outer leg) and intensity levels (60%, 70%, 80%, and 90% of MAS) for PWR, kinematic parameters (CAD, VO, GCT, and SL), and SmO2.
A separate one-way ANOVA was performed to examine differences in asymmetry indices for PWR, kinematic parameters (CAD, VO, GCT, and SL), and SmO2 across intensity levels. Asymmetry (%) for each variable was calculated according to the following equation:
where Xr represents the SmO2 recorded from the right leg and Xl represents the corresponding SmO2 recorded from the left leg. This approach follows established protocols (Karamanidis et al., 2003; Knapik et al., 1991).
In both the two-way repeated-measures ANOVA and the one-way ANOVA for asymmetry indices, post hoc pairwise comparisons were conducted using Holm’s correction method to control the family-wise error rate due to multiple testing, and adjusted p-values are reported. For pairwise comparisons following the two-way ANOVA, effect sizes were calculated using Cohen’s d, with values of 0.2, 0.5, and 0.8 interpreted as small, medium, and large effects, respectively (Cohen, 1988). For the one-way ANOVA applied to normally distributed asymmetry indices (e.g., SmO₂ ASYM), effect sizes were estimated using partial eta squared (η²p), with thresholds of .01, .06, and .14 considered small, medium, and large effects, respectively (Richardson, 2011). In contrast, for asymmetry indices that did not meet the normality assumption (e.g., PWR ASYM, CAD ASYM, VO ASYM, GCT ASYM, and SL ASYM), the Friedman test was applied, followed by Wilcoxon signed-rank tests with Holm’s correction for pairwise comparisons; in these cases, effect sizes were calculated using Kendall’s W, interpreted as small (.1), moderate (.3), and large (.5) levels of agreement (Tomczak & Tomczak, 2014).
All statistical analyses were performed using Microsoft Excel (version 16.81, 24011420) and JASP (version 0.18.3). Statistical significance was set at p < .05 for global effects.
Results
The participants (n = 14) achieved a maximal heart rate (HRmax) of 183.5 ± 15.6 bpm and a MAS of 18.53 ± 1.02 km·h-1 during the VAM-EVAL test. SmO2, PWR, and kinematic parameters showed progressive changes in response to the increasing running velocity throughout the test.
During the incremental stages of the VAM-EVAL test (60%, 70%, 80%, and 90% of MAS), PWR, CAD, and SL increased significantly in both legs at all intensities, whereas GCT decreased significantly across all intensities (all p < .05) (Table 2). A significant main effect of Leg was observed for PWR (F(1,13) = 13.62, p = .003, η²p = .512), VO (F(1,13) = 7.97, p = .014, η²p = .38), GCT (F(1,13) = 6.51, p = .024, η²p = .334) and SL (F(1,13) = 21.26, p < .001, η²p = .621). However, post hoc comparisons between inner and outer legs at each intensity level only reached statistical significance after Holm correction for PWR at 80% of MAS (t(13) = −4.455, p = .003, d = −0.29), SL at 70% of MAS (t(13) = −6.298, p < .001, d = −0.37) and SL at 80% of MAS (t(13) = −4.717, p < .001, d = −0.47) This suggests a consistent main effect of Leg in VO and GCT, with one leg systematically differing from the other across all intensities. However, the lack of a significant Leg × Intensity interaction indicates that the magnitude of this inter-limb difference remained stable, regardless of intensity level. No significant inter-leg differences were found for CAD (p = .313, η²p = .08) or SmO₂ (p = .976, η²p = .00).
Table 2
Descriptive data for both legs in PWR, CAD, VO, GCT, SL, and SmO₂ during the VAM-EVAL test (n = 14; significant differences (p < .05) across intensity levels are indicated)
Effect size analysis revealed moderate to large inter-limb differences for PWR, VO, GCT, and SL (η²p ranging from .33 to .62). In contrast, GCT, SL, and PWR exhibited marked intra-limb adaptations with increasing intensity, as reflected by highly significant intensity effects and partial eta squared values exceeding .95 (Table 3). Both the inner and outer legs exhibited very large within-limb effect sizes in response to increasing intensity, particularly for GCT, SL, and PWR. Effect sizes ranged from 1.07 to 3.26 for PWR, from 1.75 to 6.97 for GCT, and from 1.38 to 4.76 for SL. CAD and SmO₂ also showed within-limb changes, although with smaller magnitudes. Effect sizes ranged from 0.52 to 2.16 for CAD and from 0.08 to 1.15 for SmO₂, suggesting moderate to large intra-limb adjustments, particularly at higher intensity levels. In contrast, VO displayed only small and inconsistent effect sizes (d = 0.08 to 0.39), indicating limited responsiveness to increasing intensity.
Table 3
Results of the two-way repeated-measures ANOVA for PWR, CAD, VO, GCT, SL, and SmO₂ during the VAM-EVAL test (n = 14)
Regarding inter-limb asymmetry values, no significant differences were observed in PWR, CAD, SL, VO, or GCT across the different intensity levels (Table 4). However, asymmetry in SmO₂ showed significant differences between 60–90% and 70–90% of MAS (p < .05).
Table 4
Descriptive data for asymmetry indices in PWR, CAD, VO, GCT, SL, and SmO2 across intensity levels (60%, 70%, 80%, and 90% of MAS; significant differences between intensity levels (p < .05) are indicated)
Table 5
Results of the statistical analyses for inter-limb asymmetry indices across intensity levels during the VAM-EVAL test
Effect size analysis revealed small to large effects for SmO₂ asymmetry across intensities, ranging from small (60–70% MAS: d = 0.081; 70–80% MAS: d = 0.266) to moderate (60–80% MAS: d = 0.347; 80–90% MAS: d = 0.574) and large (60–90% MAS: d = 0.921; 70–90% MAS: d = 0.840) (Table 4). These results suggest that SmO₂ asymmetry progressively increases as running intensity rises.
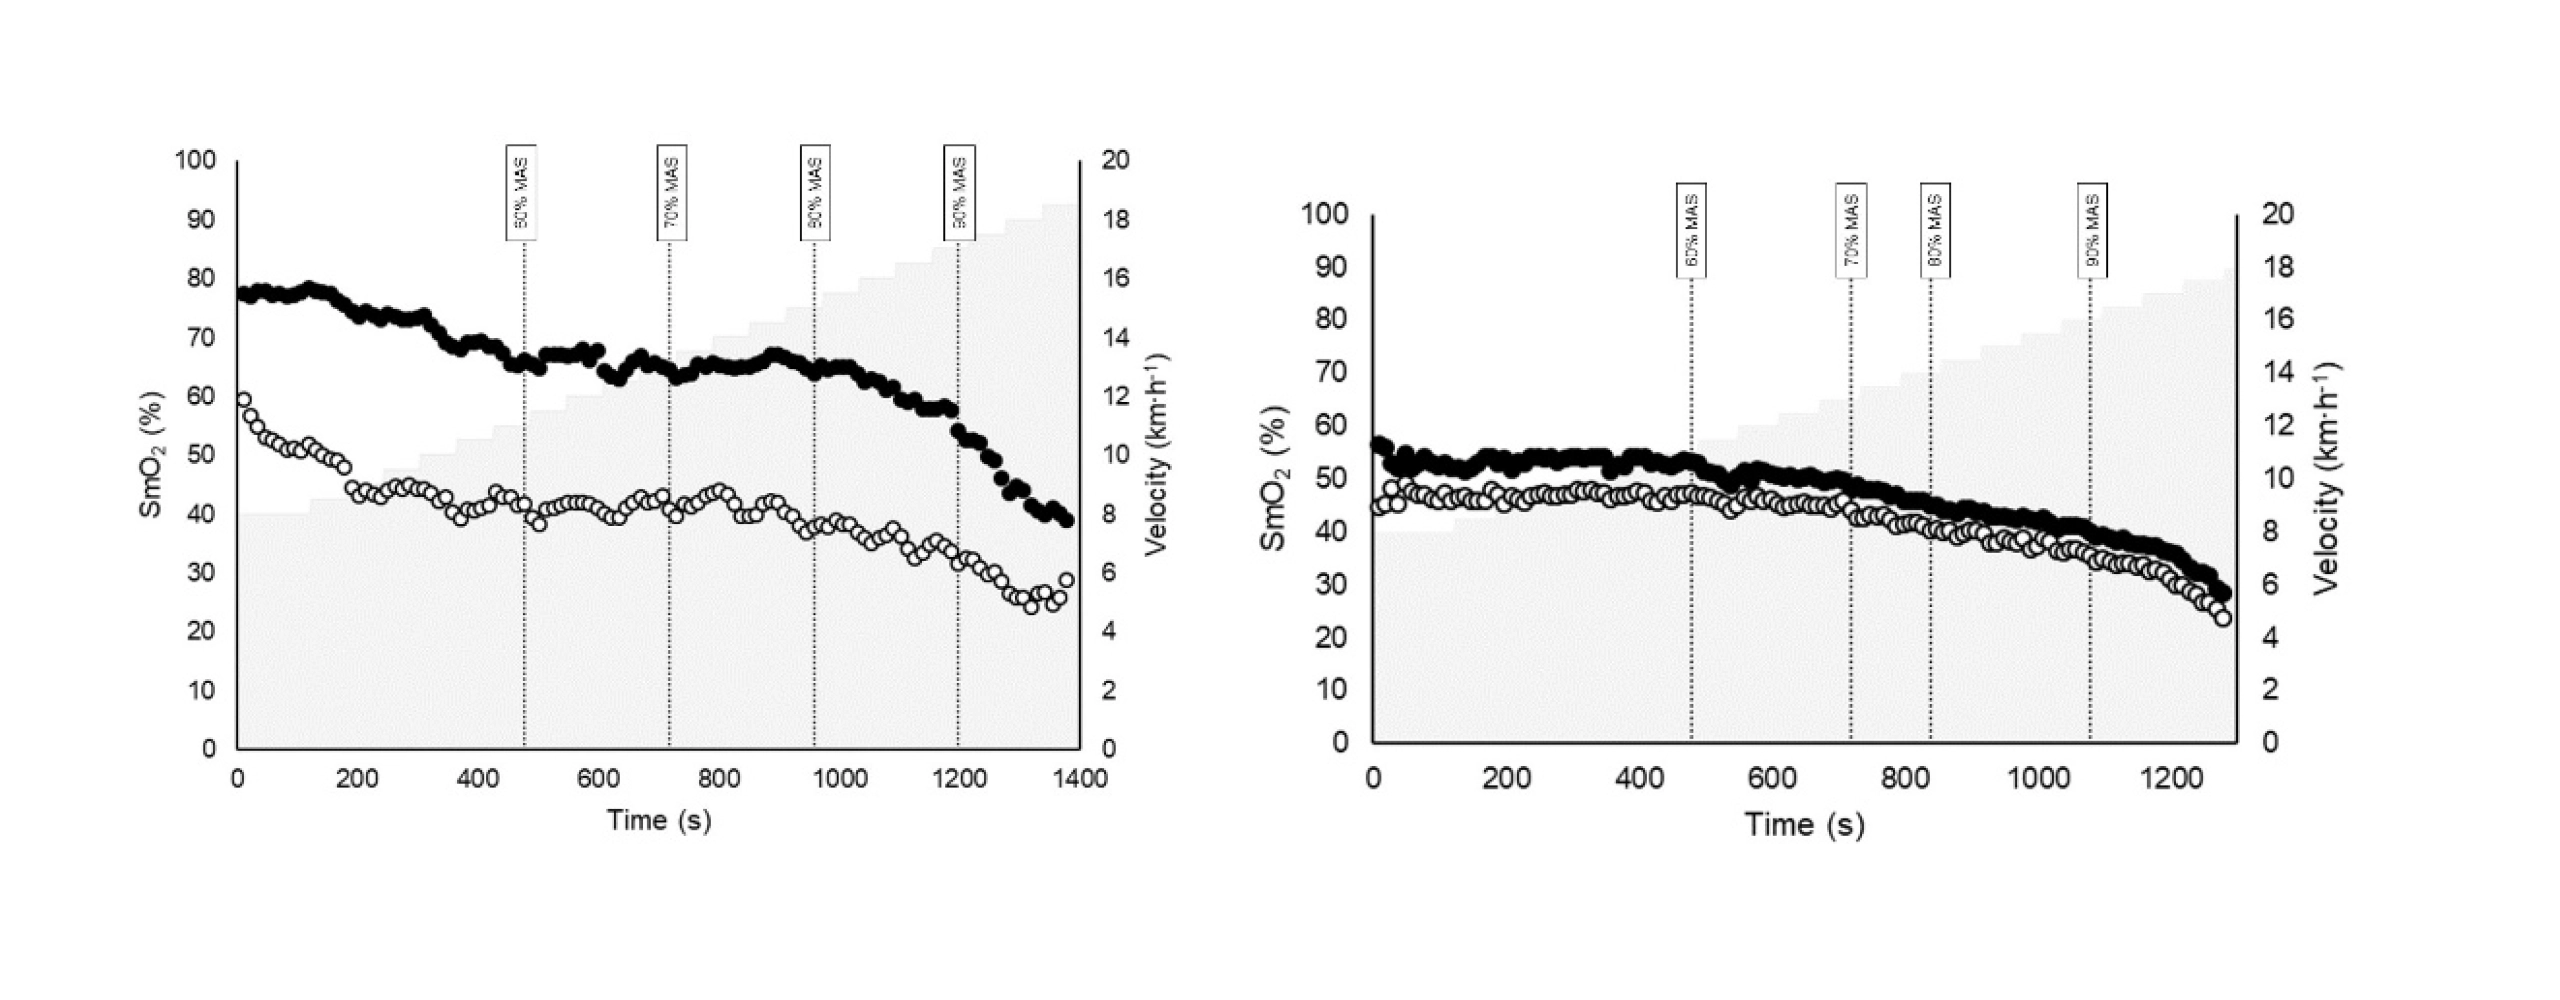
Figure 1 illustrates the SmO₂ patterns of both legs in two representative participants. The left panel showed a participant exhibiting marked asymmetries, whereas the right panel depicts one with no observable asymmetry. In the asymmetric participant, although the absolute SmO₂ values differ substantially between legs, the temporal saturation profiles remain notably similar across intensities.
Discussion
This study is among the first to examine power, kinematic, and muscle oxygenation asymmetries between the inner and outer legs during incremental 400-m track running in an ecological outdoor setting. Most previous research in this area has been conducted under controlled indoor laboratory conditions, which may not fully capture the biomechanical and physiological complexities of real-world running.
The first aim was to determine whether running on a 400-m track induces measurable differences in PWR, kinematic variables (CAD, VO, GCT, SL), and SmO₂ between the inner and outer legs. The main findings revealed significant main effects of Leg for PWR, SL, VO, and GCT, indicating systematic inter-limb differences across all intensity levels. However, post hoc analyses identified statistically significant differences only at specific intensities (PWR at 80% of MAS, and SL at both 70% and 80% of MAS), while no significant inter-limb differences were observed for CAD or SmO₂. Furthermore, the absence of significant Leg × Intensity interactions suggests that these asymmetries remained stable throughout the incremental protocol rather than increasing with exercise intensity.
The second aim was to evaluate the extent and progression of inter-limb asymmetries as running intensity increased. The main findings showed that asymmetry indices for PWR, CAD, VO, GCT, and SL did not change significantly across intensity levels, suggesting stable mechanical symmetry throughout the test. In contrast, SmO₂ asymmetry increased progressively with intensity, with large effect sizes observed at 90% MAS. This physiological divergence suggests a growing imbalance in local muscle oxygenation between limbs under higher metabolic stress, highlighting SmO₂ as a sensitive and potentially early marker of load-dependent asymmetry during high-speed running.
These findings partially align with previous studies reporting kinematic alterations during curved running; however, important methodological differences must be considered when comparing results. For instance, the studies by Chang and Kram (2007) and Hamill et al. (1987) demonstrated that curved track running affects key kinematic variables such as CAD, SL, SF, VO, and GCT. It is important to acknowledge substantial differences in their experimental conditions compared with those of the present study. Specifically, Chang and Kram (2007) investigated running on curves with a much smaller radius (6 m) than that of a standard athletics track (36.5 m), and their participants ran at maximal sprinting speeds, in contrast to the submaximal intensities used in our protocol (up to 100% of MAS; 5.15 ± 0.28 m·s-1). Similarly, Hamill et al. (1987) examined running at a considerably higher velocity (6.31 ± 5 m·s-1) than the pace maintained by the triathletes in our study. These methodological differences produced much greater centrifugal forces, thereby amplifying the kinematic disparities between the inner and outer legs observed in their findings.
We also observed that as running intensity increased, significant rises were observed in PWR, CAD, and SL in both legs across all intensity levels. Specifically, PWR in the IL increased by 13.6%, 13.2%, and 10.4% between 60–70%, 70–80%, and 80–90% of MAS, respectively. Similarly, PWR in the OL increased by 13.9%, 11.2%, and 11.9% across the same intervals. Regarding CAD, both legs exhibited moderate but consistent increases with intensity. CAD in the IL rose by 2.1%, 2.2%, and 3.4%, while the OL showed slightly smaller but progressive increments of 1.7%, 2.4%, and 3.6% across the corresponding intervals. SL also increased with intensity, although the rate of increase declined as it approached 90% of MAS. In the IL, SL rose by 13.7%, 11.5%, and 8.0%, while in the OL, increases of 13.2%, 11.1%, and 9.3% were observed. Conversely, GCT consistently decreased in both legs as intensity increased. For the IL, GCT declined by −9.8%, −8.7%, and −6.8% between 60–70%, 70–80%, and 80–90% of MAS, respectively. In the OL, the reductions were −9.8%, −8.9%, and −7.6% across the same intensity ranges. These findings align with those of Patoz et al. (2023), particularly regarding the consistency of biomechanical responses across increasing running intensities. Similar to their observations at 90%–120% of peak aerobic speed, our data revealed no significant Leg × Intensity interactions (p > .05), indicating a uniform adaptation pattern in both limbs. Additionally, both studies reported stable cadence (stride frequency) and vertical oscillation despite increasing fatigue, suggesting that runners prioritize maintaining movement rhythm and center-of-mass control. The significant effect of intensity observed in our ground contact time data also supports their interpretation that runners adopt spatiotemporal strategies, such as modulating contact time, to optimize load distribution during high-intensity efforts. While both studies focused on biomechanical responses to submaximal and near-maximal intensities, our protocol was slightly less demanding. In our study, athletes performed a continuous incremental test without rest periods, whereas Patoz et al. (2023) conducted four separate exhaustive trials at fixed percentages of each participant’s peak speed, performed in randomized order.
In addition to the mechanical adjustments observed in spatiotemporal parameters, physiological responses at the muscular level also showed meaningful trends as intensity increased. In particular, muscle oxygen saturation (SmO₂) progressively decreased in both the inner and outer leg throughout the incremental protocol. This response is consistent with previous studies on muscle oxygenation during graded exercise, which reported a continuous decline in SmO₂ due to increased oxygen extraction demands (Grassi et al., 1999). The present findings confirm this pattern, especially at higher intensities such as 90% of MAS.
No significant differences were observed between the inner and outer leg (p = .976), nor was there a significant Leg × Intensity interaction (p = .068). However, there was a strong main effect of intensity (p < .001, η²p = .697), indicating that SmO₂ responded markedly to increases in running speed. These results suggest that the observed changes in SmO₂ reflect a global physiological adaptation to elevated metabolic demand, without clear evidence of functional imbalances between the inner and outer leg in terms of muscle oxygenation.
The secondary aim of this study was to evaluate the extent of asymmetries in PWR, kinematic variables (CAD, VO, GCT, and SL), and SmO2 in national-level triathletes during a VAM-EVAL test. The main findings showed no significant differences across intensities, except for SmO2, which exhibited significant changes between 60–90% and 70–90% of MAS. These results suggest that SmO₂ asymmetries become more pronounced at higher exercise intensities, particularly at 90% of MAS, indicating that as running intensity increases, oxygen utilization disparities between legs become more evident in triathletes.
To better contextualize these findings, it is essential to consider the underlying physiological mechanisms that may explain the observed asymmetries. The presence of significant SmO₂ asymmetry, despite symmetrical mechanical outputs such as power and stride length, points toward the role of intrinsic muscular factors. In particular, local variations in capillarization and vascular adaptations may contribute to these disparities. Capillarization is a key determinant of oxygen delivery and diffusion; specifically, parameters such as capillary density and the number of capillary contacts per fiber area (CC/FA) are associated with more efficient O₂ extraction, a relationship particularly robust in young populations (Chilibeck et al., 1997). Moreover, vascular adaptations induced by endurance training tend to be localized, with enhanced microvascular responsiveness occurring primarily in the tissues directly involved in the effort (Soares et al., 2018).
Internal physiological processes may remain asymmetric due to differences in local muscle perfusion or oxidative metabolism. In this context, circulatory adjustments mediated by autonomic reflexes, such as the exercise pressor reflex, may favor blood flow redistribution toward the most metabolically active muscles, potentially limiting oxygen delivery to non-active or synergistic muscles. These mechanisms are part of the broader autonomic response to increased metabolic demand and play a role in modulating limb-specific vascular responses during intense exercise (Orcioli-Silva et al., 2024).
Additionally, neuromuscular strategies such as muscle co-activation contribute to these internal asymmetries. At higher running speeds, global co-activation increases, occurring earlier and for shorter durations to enhance whole-limb stiffness and joint stabilization (Fiori et al., 2024). Importantly, the relationship between muscle excitation (RMS) and SmO₂ is not uniform across all muscles. While power-generating muscles like the vastus lateralis show a clear inverse pattern (RMS increases while SmO₂ decreases) due to higher metabolic demand, some stabilizers, such as the gastrocnemius medialis, maintain both stable SmO₂ and RMS levels throughout exercise (Sendra-Pérez et al., 2025). This reflects their distinct functional roles, as stabilizing muscles are more involved in load regulation than in force generation. These findings highlight the complex interplay of neuromuscular and vascular mechanisms that modulate SmO₂ dynamics. Since the present study focused exclusively on the vastus lateralis, examining additional muscles with diverse functional roles would provide a more comprehensive understanding of these physiological asymmetries.
While previous studies have typically assessed SmO₂ symmetry using statistical agreement methods and absolute inter-limb differences, our analysis employed a normalized asymmetry index (ASI%) to express the relative disparity between legs. In controlled laboratory settings, Sendra-Pérez et al. (2025) defined symmetry based on absolute SmO₂ differences ranging from 10% to 20%, while Skotzke et al. (2024) used Bland–Altman analysis to establish limits of agreement (LoA) of ± 20%, finding that such inter-limb differences are common and not linked to leg dominance. In contrast, our ASI% values during outdoor running ranged from 24.4% to 53.5%, exceeding both the laboratory thresholds and the minimal detectable change (MDC) of 18% reported by Skotzke et al. (2024) for SmO₂ in cycling.
However, it is important to note that the ASI% is mathematically sensitive to low absolute values. Since SmO₂ levels declined markedly at high intensities (e.g., ~25% at 90% MAS), even moderate absolute differences may yield disproportionately high ASI% values. To validate our findings, we conducted a Bland–Altman analysis across all intensities. The results revealed minimal systematic bias across 60%, 70%, and 80% of MAS (−2.6% ± 24.0%, +0.2% ± 24.3%, and +0.3% ± 28.3%, respectively), with relatively consistent limits of agreement. At 90% MAS, although SmO₂ values were lower, the bias remained small (+1.7%), and the LoA (± 25.68%) did not widen substantially compared to previous stages. Compared to Skotzke et al. (2024), who reported LoA of ± 20% during steady-state cycling, our results show slightly wider but still comparable levels of physiological asymmetry under more demanding, field-based running conditions. These results suggest that while physiological asymmetries in SmO₂, as captured by ASI%, do become more evident with increasing intensity, the magnitude of the relative asymmetry should be interpreted cautiously, especially under conditions of low oxygen saturation.
According to the recent systematic review by D’Hondt et al. (2024), the relationship between inter-limb asymmetry and endurance running performance is complex. Their findings indicate that some (but not all) functional, morphological, kinematic, and kinetic asymmetry metrics are negatively associated with, or show no significant relationship to, running performance. In the present study, despite exhibiting significant SmO₂ asymmetries, particularly at higher intensities, the triathletes achieved a performance level of 3 according to the classification proposed by De Pauw et al. (2013). To analyze asymmetries in greater depth, it would have been beneficial to perform a preliminary body composition assessment using dual-energy X-ray absorptiometry (DXA) to evaluate total body composition and identify potential differences in muscle mass between legs. Branski et al. (2010) demonstrated that lean mass asymmetry influences strength and power asymmetry during jumping tasks in collegiate athletes. In addition, conducting specific unilateral strength tests for runners could have provided insight into potential strength imbalances between limbs. Such an approach would have allowed for a more comprehensive interpretation of the observed differences in muscle oxygen saturation.
Limitations and Further Research
This study has some limitations that should be considered. First, the sample size was relatively small and included only male national-level triathletes, which may limit the generalizability of the findings to other populations, such as female athletes or recreational runners. Second, SmO2 was measured exclusively in the vastus lateralis. Including additional muscles involved in running could have offered a broader view of inter-limb physiological asymmetries. Third, no direct measures of unilateral muscle strength, neuromuscular function, or body composition asymmetry, were included, which could have contributed to a deeper interpretation of the observed SmO₂ asymmetries. Finally, although conducting the test in an outdoor setting adds ecological validity, it may also have introduced more variability compared to laboratory-based conditions.
Future research should continue to emphasize ecological settings to more accurately reflect the demands of outdoor running. Moreover, integrating body composition analyses and specific strength assessments for both legs could help identify the physiological origins of SmO₂ asymmetries. Expanding these studies would contribute to a deeper understanding of the physiological and biomechanical mechanisms underlying inter-limb imbalances and their potential implications for athletic performance. Finally, future investigations should incorporate systematic observation and video analysis tools (Soto et al., 2019) to enhance the reliability of motion analysis in applied sport environments.
Conclusions
The findings of this study on national-level male triathletes performing an incremental 400-m track running test indicate that, although no asymmetries were observed in power output or kinematic parameters, muscle oxygen saturation asymmetries became evident as running intensity increased. These asymmetries were not attributable to the curved running trajectory, since no significant differences were found between the inner and outer legs, except for power output at 80% of maximal aerobic speed (MAS) and step length at 70% and 80% of MAS. While mechanical parameters remained largely symmetrical, the progressive divergence in SmO₂ values suggests a physiological imbalance that becomes more pronounced at higher intensities, highlighting SmO₂ as a sensitive marker of internal load-dependent asymmetries, even in the absence of mechanical discrepancies.
Acknowledgements
The authors would like to thank the National Institute of Physical Education of Catalonia (INEFC) and the INEFC Barcelona Sports Sciences Research Group (GRCEIB, https://inefc-grceib.cat) for their institutional support, as well as Josep Tarrés for his collaboration in the data collection process.
The authors declare that no generative artificial intelligence tools were used in the writing, data analysis, or interpretation of this manuscript, in accordance with the publication policies of Apunts.
Funding
This study was funded by the National Institute of Physical Education of Catalonia (INEFC) of the Generalitat de Catalunya. The funders had no role in study design, data collection and analysis, decision to publish, or preparation of the manuscript.
References
[1] Alt, T., Heinrich, K., Funken, J., & Potthast, W. (2015). Lower extremity kinematics of athletics curve sprinting. Journal of Sports Sciences, 33(6), 552–560. doi.org/10.1080/02640414.2014.960881
[2] Bell, D. R., Sanfilippo, J. L., Binkley, N., & Heiderscheit, B. C. (2014). Lean mass asymmetry influences force and power asymmetry during jumping in collegiate athletes. Journal of Strength and Conditioning Research, 28(4), 884–891. doi.org/10.1519/JSC.0000000000000367
[3] Bini, R., & Hume, P. (2015). Relationship between pedal force asymmetry and performance in cycling time trial. Journal of Sports Medicine and Physical Fitness, 55(9), 892–898.
[4] Bishop, C., Read, P., Brazier, J., Jarvis, P., Chavda, S., Bromley, T., & Turner, A. (2021). Effects of interlimb asymmetries on acceleration and change of direction speed: A between-sport comparison of professional soccer and cricket athletes. Journal of Strength and Conditioning Research, 35(8), 2095–2101. doi.org/10.1519/JSC.0000000000003135
[5] Bishop, C., Read, P., Bromley, T., Brazier, J., Jarvis, P., Chavda , S., & Turner, A. (2022). The association between interlimb asymmetry and athletic performance tasks: A season-long study in elite academy soccer players. Journal of Strength and Conditioning Research, 36(3), 787–795. doi.org/10.1519/JSC.0000000000003526
[6] Bishop, C., Turner, A., & Read, P. (2017). Effects of inter-limb asymmetries on physical and sports performance: A systematic review. Journal of Sports Sciences, 36(10), 1135–1144. doi.org/10.1080/02640414.2017.1361894
[7] Branski, L. K., Norbury, W. B., Herndon, D. N., Chinkes, D. L., Cochran, A., Suman, O., Benjamin, D., & Jeschke, M. G. (2010). Measurement of body composition in burned children: Is there a gold standard? JPEN: Journal of Parenteral and Enteral Nutrition, 34(1), 55–63. doi.org/10.1177/0148607109336601
[8] Cerezuela-Espejo, V., Hernández-Belmonte, A., Courel-Ibáñez, J., Conesa-Ros, E., Mora-Rodríguez, R., & Pallarés, J. G. (2021). Are we ready to measure running power? Repeatability and concurrent validity of five commercial technologies. European Journal of Sport Science, 21(3), 341–350. doi.org/10.1080/17461391.2020.1748117
[9] Chang, Y. H., & Kram, R. (2007). Limitations to maximum running speed on flat curves. Journal of Experimental Biology, 210(6), 971–982. doi.org/10.1242/jeb.02728
[10] Chilibeck, P. D., Paterson, D. H., Cunningham, D. A., Taylor, A. W., & Noble, E. G. (1997). Muscle capillarization, O2 diffusion distance, and VO₂ kinetics in old and young individuals. Journal of Applied Physiology, 82(1), 63–69. doi.org/10.1152/jappl.1997.82.1.63
[11] Cohen, J. (1988). Statistical power analysis for the behavioral sciences (2nd ed.). Routledge. doi.org/10.4324/9780203771587
[12] Connick, M. J., & Li, F. X. (2015). Prolonged cycling alters stride time variability and kinematics of a post-cycle transition run in triathletes. Journal of Electromyography and Kinesiology, 25(1), 34–39. doi.org/10.1016/j.jelekin.2014.08.009
[13] D’Hondt, J., Chapelle, L., Bishop, C., Aerenhouts, D., Pauw, K.D., Clarys, P., & D’Hondt, E. (2024). Association between inter-limb asymmetry and endurance running performance in healthy populations: A systematic review. Sports Med - Open, 10(127). doi.org/10.1186/s40798-024-00790-w
[14] Feldmann, A., Schmitz, R., & Erlacher, D. (2019). Near-infrared spectroscopy-derived muscle oxygen saturation on a 0% to 100% scale: Reliability and validity of the Moxy Monitor. Journal of Biomedical Optics, 24(11), 115001. doi.org/10.1117/1.JBO.24.11.115001
[15] Fiori, L., Castiglia, S. F., Chini, G., Draicchio, F., Sacco, F., Serrao, M., Tatarelli, A., Varrecchia, T., & Ranavolo, A. (2024). The lower limb muscle co-activation map during human locomotion: From slow walking to running. Bioengineering, 11(3), 288. doi.org/10.3390/bioengineering11030288
[16] Fox, K. T., Pearson, L. T., & Hicks, K. M. (2023). The effect of lower inter-limb asymmetries on athletic performance: A systematic review and meta-analysis. PLoS One, 18(6), e0286942. doi.org/10.1371/journal.pone.0286942
[17] García, G. C., & Secchi, J. D. (2013). Relationship between the final speeds reached in the 20 metre Course Navette and the MAS-EVAL test. A proposal to predict the maximal aerobic speed. Apunts Medicina de l’Esport, 48(177), 27–34. doi.org/10.1016/j.apunts.2011.11.004
[18] Gilgen-Ammann, R., Taube, W., & Wyss, T. (2017). Gait asymmetry during 400- to 1000-m high-intensity track running in relation to injury history. International Journal of Sports Physiology and Performance, 12(S2), S2-157-S2-160. doi.org/10.1123/ijspp.2016-0379
[19] Grassi, B., Quaresima, V., Marconi, C., Ferrari, M., & Cerretelli, P. (1999). Blood lactate accumulation and muscle deoxygenation during incremental exercise. Journal of Applied Physiology, 87(1), 348–355. doi.org/10.1152/jappl.1999.87.1.348
[20] Hamill, J., Murphy, M., & Sussman, D. (1987). The effects of track turns on lower extremity function. International Journal of Sport Biomechanics, 3(3), 276–286. doi.org/10.1123/ijsb.3.3.276
[21] Heiden, T., & Burnett, A. (2003). The effect of cycling on muscle activation in the running leg of an Olympic distance triathlon. Sports Biomechanics, 2(1), 35–49. doi.org/10.1080/14763140308522806
[22] Helme, M., Tee, J., Emmonds, S., & Low, C. (2021). Does lower-limb asymmetry increase injury risk in sport? A systematic review. Physical Therapy in Sport, 49, 204–213. doi.org/10.1016/j.ptsp.2021.03.001
[23] Jacques, T., Bini, R., & Arndt, A. (2021). Running after cycling induces inter-limb differences in muscle activation but not in kinetics or kinematics. Journal of Sports Sciences, 39(2), 154–160. doi.org/10.1080/02640414.2020.1809176
[24] Karamanidis, K., Arampatzis, A., & Brüggemann, G.-P. (2003). Symmetry and reproducibility of kinematic parameters during various running techniques. Medicine and Science in Sports and Exercise, 35(6), 1009–1016. doi.org/10.1249/01.MSS.0000069337.49567.F0
[25] Knapik, J. J., Bauman, C. L., Jones, B. H., Harris, J. M., & Vaughan, L. (1991). Preseason strength and flexibility imbalances associated with athletic injuries in female collegiate athletes. American Journal of Sports Medicine, 19(1), 76–81. doi.org/10.1177/036354659101900113
[26] Léger, L., & Boucher, R. (1980). An indirect continuous running multistage field test: the Université de Montréal track test. Canadian journal of applied sport sciences. Journal canadien des sciences appliquées au sport, 5(2), 77–84.
[27] Loturco, I., Pereira, L. A., Kobal, R., Abad, C. C. C., Rosseti, M., Carpes, F. P., & Bishop, C. (2019). Do asymmetry scores influence speed and power performance in elite female soccer players? Biology of Sport, 36(3), 209–216. doi.org/10.5114/biolsport.2019.85454
[28] McManus, C. J., Collison, J., & Cooper, C. E. (2018). Performance comparison of the MOXY and PortaMon near-infrared spectroscopy muscle oximeters at rest and during exercise. Journal of Biomedical Optics, 23(1), 015007. doi.org/10.1117/1.JBO.23.1.015007
[29] Millet, G. P., & Vleck, V. E. (2000). Physiological and biomechanical adaptations to the cycle to run transition in Olympic triathlon: review and practical recommendations for training. British journal of sports medicine, 34(5), 384–390. doi.org/10.1136/bjsm.34.5.384
[30] Olcina, G., Perez-Sousa, M. Á., Escobar-Alvarez, J. A., & Timón, R. (2019). Effects of cycling on subsequent running performance, stride length, and muscle oxygen saturation in triathletes. Sports, 7(5), 115. doi.org/10.3390/sports7050115
[31] Orcioli-Silva, D., Beretta, V. S., Santos, P. C. R., Rasteiro, F. M., Marostegan, A. B., Vitório, R., Gobatto, C. A., & Manchado-Gobatto, F. B. (2024). Cerebral and muscle tissue oxygenation during exercise in healthy adults: A systematic review. Journal of sport and health science, 13(4), 459–471. doi.org/10.1016/j.jshs.2024.03.003
[32] Patoz, A., Blokker, T., Pedrani, N., Spicher, R., Borrani, F., & Malatesta, D. (2023). Biomechanical adaptations during exhaustive runs at 90 to 120% of peak aerobic speed. Scientific Reports, 13, 8236. doi.org/10.1038/s41598-023-35345-8
[33] Pauw, K.D., Roelands, B., Cheung, S. S., de Geus, B., Rietjens, G., & Meeusen, R. (2013). Guidelines to classify subject groups in sport-science research. International Journal of Sports Physiology and Performance, 8(2), 111–122. doi.org/10.1123/ijspp.8.2.111
[34] Richardson, J. T. (2011). Eta squared and partial eta squared as measures of effect size in educational research. Educational research review, 6(2), 135–147. doi.org/10.1016/j.edurev.2010.12.001
[35] Sendra-Pérez, C., Priego-Quesada, J. I., Murias, J. M., Carpes, F. P., Salvador-Palmer, R., & Encarnación-Martínez, A. (2025). Evaluation of leg symmetry in muscle oxygen saturation during submaximal to maximal cycling exercise. European Journal of Sport Science, 25(1), e12230. doi.org/10.1002/ejsc.12230
[36] Skotzke, P., Schwindling, S., & Meyer, T. (2024). Side differences and reproducibility of the Moxy muscle oximeter during cycling in trained men. European Journal of Applied Physiology, 124, 3075–3083. doi.org/10.1007/s00421-024-05514-2
[37] Soares, R. N., George, M. A., Proctor, D. N., & Murias, J. M. (2018). Differences in vascular function between trained and untrained limbs assessed by near-infrared spectroscopy. European Journal of Applied Physiology, 118, 2241–2248. doi.org/10.1007/s00421-018-3955-3
[38] Soto, A., Camerino, O., Iglesias, X., Anguera, M. T., & Castañer, M. (2019). LINCE PLUS: Research software for behaviour video analysis. Apunts. Educación Física y Deportes, 137, 149–153. doi.org/10.5672/apunts.2014-0983.es.(2019/3).137.11
[39] Tomczak, E. & Tomczak, M. (2014). The need to report effect size estimates revisited. An overview of some recommended measures of effect size. TRENDS in Sport Sciences, 21(1).
[40] van der Zwaard, S., Jaspers, R. T., Blokland, I. J., Achterberg, C., Visser, J. M., den Uil, A. R., Hofmijster, M. J., Levels, K., Noordhof, D. A., de Haan, A., de Koning, J. J., van der Laarse, W. J., & de Ruiter, C. J. (2016). Oxygenation Threshold Derived from Near-Infrared Spectroscopy: Reliability and Its Relationship with the First Ventilatory Threshold. PloS one, 11(9), e0162914. doi.org/10.1371/journal.pone.0162914
[41] van Rassel, C. R., Ajayi, O. O., Sales, K. M., Griffiths, J. K., Fletcher, J. R., Edwards, W. B., & MacInnis, M. J. (2023). Is running power a useful metric? Quantifying training intensity and aerobic fitness using Stryd running power near the maximal lactate steady state. Sensors, 23(21), 8729. doi.org/10.3390/s23218729
[42] Vasquez-Bonilla, A. A., Brazo-Sayavera, J., Timón, R., & Olcina, G. (2022). Monitoring muscle oxygen asymmetry as a strategy to prevent injuries in footballers. Research Quarterly for Exercise and Sport, 94(3), 609–617. doi.org/10.1080/02701367.2022.2026865
[43] Vasquez-Bonilla, A., Tomas-Carus, P., Brazo-Sayavera, J., Malta, J., Folgado, H., & Olcina, G. (2023). Muscle oxygenation is associated with bilateral strength asymmetry during isokinetic testing in sport teams. Science & Sports, 38(4), 426.e1–426.e9. doi.org/10.1016/j.scispo.2022.03.014
[44] World Athletics. (2019). Track and field facilities manual: Chapters 1–3. World Athletics. worldathletics.org/about-iaaf/documents/technical-information
[45] Yanci, J. (2014). Muscle strength and leg asymmetries in elite runners and cyclists: Original research article. International SportMed Journal, 15(3). hdl.handle.net/10520/EJC159075
ISSN: 2014-0983
Received: October 16, 2025
Accepted: February 27, 2026
Published: July 1, 2026
Editor: © Generalitat de Catalunya Departament de la Presidència Institut Nacional d’Educació Física de Catalunya (INEFC)
© Copyright Generalitat de Catalunya (INEFC). This article is available from url https://www.revista-apunts.com/. This work is licensed under a Creative Commons Attribution-NonCommercial-NoDerivatives 4.0 International License. The images or other third party material in this article are included in the article’s Creative Commons license, unless indicated otherwise in the credit line; if the material is not included under the Creative Commons license, users will need to obtain permission from the license holder to reproduce the material. To view a copy of this license, visit https://creativecommons.org/licenses/by-nc-nd/4.0/deed.en


