Kinematics, arm coordination, and oxygen uptake in swimmers with amputations in all-out front crawl test
Daniela Ogaratto
Wellington G. Feitosa
Daniela H. Gonzalez
Flávio A. de S. Castro
*Corresponding author: Wellington G. Feitosa wellington.feitosa@uece.br
Cite this article
Ogaratto, D., Feitosa, W.G. & de S. Castro, F.A. (2023). Kinematics, arm coordination, and oxygen uptake in swimmers with amputations in all-out front crawl test. Apunts Educación Física y Deportes, 154, 44-51. https://doi.org/10.5672/apunts.2014-0983.es.(2023/4).154.04
Abstract
The aim of this study was to describe the kinematics, inter-arm coordination, and oxygen uptake of swimmers with amputations, and to verify how these parameters behave in two laps (75-100 m and 175-200 m) of an all-out 200 m front crawl test (T200). Six swimmers (four males and two females) with amputations participated (age: 30 ± 9.8 years). Anthropometric measurements were obtained, and 19 markers were placed on predetermined regions of the body for later scanning of the T200. The swimmers warmed-up and then performed the T200. The test was recorded on digital video. The images were processed (APAS software) and the videos analyzed in three dimensions (3D). Kinematic (mean stroke rate and length, swimming speed, and stroke index) and coordinative (coordination index) data were obtained from the images. During T200, oxygen uptake (VO2) was measured breath-by-breath (portable gas analyzer) and its peak value (VO2peak) was identified. Descriptive statistics and Student’s t-test for paired data were used for comparison between the laps. The performance of the swimmers assessed was 197.8 ± 24.7 s. The stroke rate, length, speed, and stroke index were, respectively, 41.0 ± 5.1 cycles/min, 1.5 ± 0.3 m, 0.98 ± 0.02 m/s, and 1.67 ± 0.59 m2/s. In general, the coordination was in capture with peak oxygen uptake of 43.6 ± 8.0 ml.kg-1.min-1. The kinematic variables and coordination did not vary between the analyzed laps.
Introduction
To be successful in competitive swimming, the athlete needs to cover a certain distance in the shortest time, under set rules. Swimming technique and energy supply must make it possible to reach and maintain the intended swimming speed. For a correct swimmers’ assessment, it is essential to obtain data related to swimming performance indicators, such as kinematic, coordinative, and physiological (Pelarigo et al., 2017; Pelarigo et al., 2018). Moreover, these factors play an important role in athlete performance as they are interconnected (Figueiredo et al., 2013).
In swimming, kinematic parameters such as the mean stroke rate (SR) and the mean stroke length (SL) are often investigated. The product between SR and SL determines the average pure swimming speed (s), without the effect of starts and turns (Craig & Pendergast, 1979). The interaction between SR and SL, according to Hay and Guimarães (1983), allows an increase in s and, consequently, in performance. However, these parameters are inversely related. To increase s acutely, the observed strategy is to increase SR. On the other hand, in response to training, the chronic effect generates an increase in s as a result of an increase in SL due to physiological and technical adaptations (Yanai, 2003). Theoretically, as a swimmer trains and improves physiological and technical skills, the SL increases, leading to greater s in more technical swimming (Castro et al., 2021). The same behavior is also expected in swimmers with amputations (Figueiredo et al., 2014).
Although swimming is recognized as a symmetrical sport, balance between each side of the body cannot be assured. Swimmers with physical and motor impairments may present even more pronounced asymmetries (Santos et al., 2020). Swimmers with upper limb amputation need to compensate for the lack of propulsive segment (Prins & Murata, 2008) and consequently use more SR to increase s (Prins & Murata, 2008; Hogarth et al., 2018). Regarding the behavior over 200 m front crawl, Castro et al. (2021) found that there was a decrease in s until the third 25 m bout and then it stabilized.
In front crawl swimming, the upper limb movements (alternating) are responsible for about 85-90% of the propulsion, generated mainly by hands and forearms, in swimmers with typical anatomy (Toussaint & Beek, 1992). However, there are phases that are not propulsive, such as recovery and entry until the hand “catches” the water (Chollet et al., 2000). Each swimmer adapts the beginning and the end of each phase for both upper limbs according to the restrictions imposed on them (s, for example). Therefore, it is important to understand the coordination of the upper limbs by the temporal identification of the beginning and end of propulsive and non-propulsive phases. In this context, swimmers with physical impairments in the upper limb (amputation in the elbow region) have a loss in propulsion compared to swimmers with typical anatomy. If this occurs, the swimmer needs to use the existing surface area of the limb to generate propulsion (Prins & Murata, 2008).
To assess the inter-arm coordination, Chollet et al. (2000) proposed the quantification of coordination (the Index of Coordination – IdC) based on the division of the stroke into four phases for each of the upper limbs, two of which are highlighted as propulsive (pull and push – submerged) and the other two as non-propulsive (recovery and entry to support). Thus, the inter-arm coordination can be described from three models: (i) opposition model, when one of the upper limbs starts the pull exactly when the other ends the push phase, resulting in a continuous series of propulsion actions; (ii) capture model, which has a time delay between the propulsion phases of the upper limbs, and (iii) superposition model, characterized by the start of the pull phase before the end of the push phase (Chollet et al., 2000).
The IdC makes it possible to identify quantitatively the coordination model adopted by the swimmer (Chollet et al., 2000). The IdC is the time between the beginning of the propulsion phase of an upper limb and the end of the propulsion phase of the other upper limb and it is calculated by means of the time delay (difference) between the start of the propulsive action of one stroke and the end of the propulsive action of the other stroke. For swimmers with upper limb amputation the IdC is adapted (IdCAdapt), which is obtained from a common point in both upper limbs (Osborough et al., 2010).
In swimming 200 m events, it is known that there are difficulties in keeping the SL constant over the distance and thus there is an increase in SR in the last laps to maintain or increase the s (Figueiredo et al., 2013). Furthermore, Ramos Junior (2017) suggests that swimmers with physical impairment have difficulty in maintaining maximal aerobic effort. Thus, checking the behavior of the kinematic and coordinative variables throughout the 200 m race allows coaches, swimmers, and researchers to clearly understand the conditions of the athlete’s swimming technique, to identify possible solutions for strategies to be adopted throughout the race, and to have more objectivity and transparency in determining the athlete’s eligibility (Payton et al., 2020; Santos et al., 2021).
It is noteworthy that there are few studies regarding the performance of swimmers with physical impairments (Feitosa et al., 2019). Therefore, the objective of this study was to analyze the performance of swimmers with amputations in the T200, through kinematic and coordination variables in two moments (75-100 m and 175-200 m) of the test, and through peak oxygen uptake.
Methods
Participants
Six volunteer swimmers (four males and two females) with upper and lower limb amputation participated in this study (mean age 30.0 ± 9.8 years; mean height 174 ± 0.07 cm; mean upper-arm span 162.3 ± 26.1 cm; mean total body mass 70.4 ± 8.6 kg), with previous experience in the sport of 5.1 ± 3.5 years. All of them trained five times a week with an average of approximately 2,800 m per training session with competitive objectives at national or international level. All of them were from sport classes S8 to S10 of the International Paralympic Committee (IPC, 2015). Participants were in the following sport classes: S8 (n = 1; male with unilateral amputation near the right shoulder); S9 (n = 4; one male with forearm amputation and three with transfemoral amputation – two males and one female) and S10 (n = 1; female with transtibial amputation). All participants had been classified in their respective sport classes in the last two months before data collection by the Brazilian Paralympic Committee. The study was approved by the Research Ethics Committee of the University where it was carried out (Comitê de Ética em Pesquisa da Universidade Federal do Rio Grande do Sul – UFRGS, number 2.274.037) and complied with national and international guidelines regarding research with human beings. All participants received and signed an Informed Consent Form to participate in the research and received verbal explanations about methods and objectives.
Anthropometric Assessment
Anthropometric measurements were collected before the T200: (i) body mass (kg), wearing swimming clothes and barefoot; (ii) height (cm), standing upright, with feet together and close to the stadiometer and upper limbs beside the trunk in a relaxed manner, the head adjusted after a deep breath, according to the Frankfurt plane (Eston & Really, 2009); and (iii) upper arm span (cm): lying on the ground, in dorsal decubitus, shoulders abducted at 90°, and elbows, wrists, and fingers in extension. The maximum distance between the extremities of the upper limbs was obtained. After the anthropometric measurements, 19 references were marked with non-toxic black ink on the swimmer’s skin to be later digitized: vertices of the shoulder, elbow, wrist, femoral trochanters, meta phalangeal joints of the fingers, and toes, knee, ankle; both on the right and left sagittal planes. These markings, approximately 2 cm in diameter, were necessary for subsequent digitization of landmarks for three-dimensional (3D) kinematic analysis (Sanders et al., 2015).
Experimental design
To familiarize participants with the test equipment, they used, for six to ten usual training sessions before the test, a conventional snorkel together with a nose clip. Along these sessions, participants performed open turns. The test protocol was an all-out 200 m front crawl (T200). Participants were instructed not to perform any physical activity and to abstain from caffeine and alcohol 24 h before the test. Before T200, the athletes performed a standardized warm-up of 600 m in front crawl stroke: 200 m at light to moderate intensity, 200 m with a conventional snorkel and the use of a nose clip, and 200 m with a snorkel (Aquatrainer, Cosmed, Italy) connected to a gas analyzer (K5, Cosmed, Italy) and a nose clip.
The swimmers performed the T200 individually and performed (i) starting from the pool edge, (ii) with open turns, always to the same side, without underwater gliding, and (iii) swimming without cervical rotational movements during breathing, due to the use of the snorkel. During the T200, a manual chronometer (CASIO HS-30W, Japan) recorded the time in seconds from the beginning to the end of the test (performance). The T200 was performed by all athletes under the same environmental conditions, in a 25 m indoor heated pool—water temperature approximately 28 °C.
Kinematic data acquisition
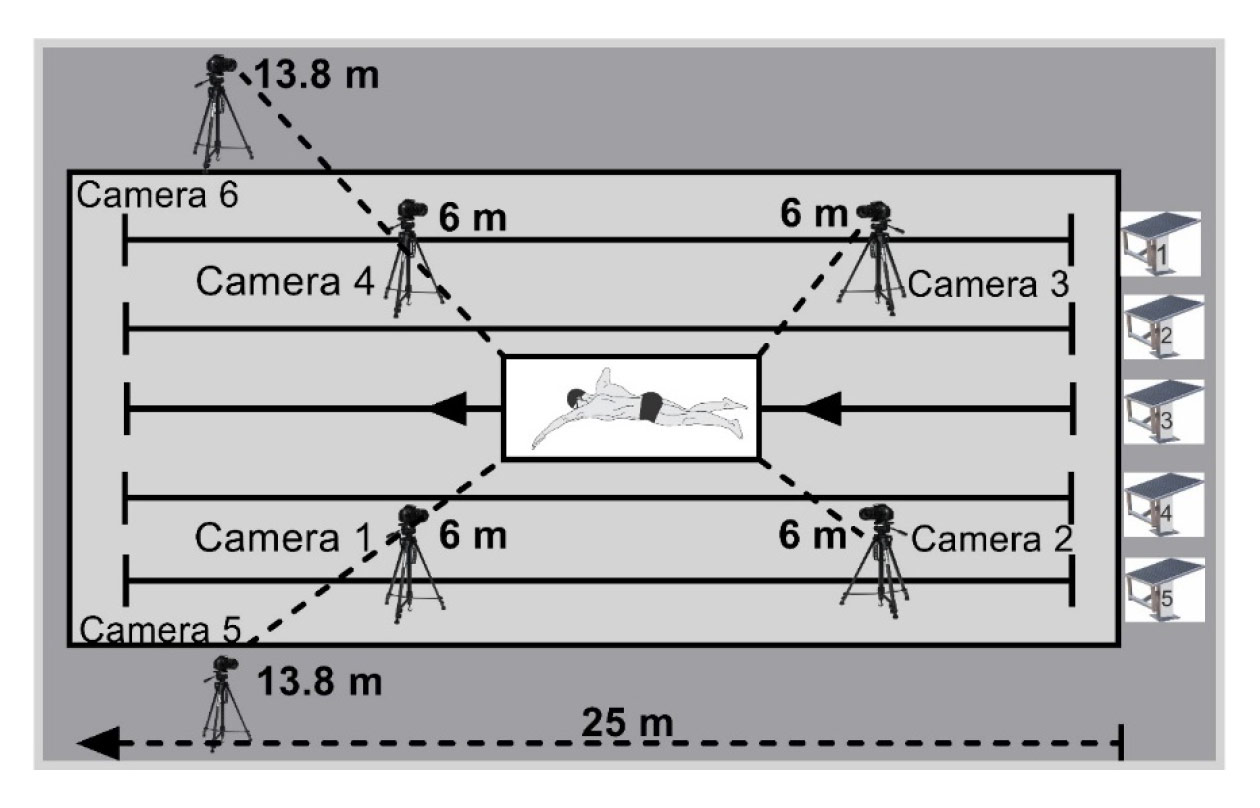
The kinematic parameters were acquired using three-dimensional (3D) videogrammetry with six fixed cameras (operating at 60 Hz), four of which were positioned underwater (0.5 m) inside watertight box, and two above water (1.52 m high from the ground) (De Jesus et al., 2015). The course swum by the athletes was recorded by the cameras within a calibrated space located in lane 3 of the pool, oriented longitudinally (x-axis as the swimmer’s direction), equidistant from both heads of the pool (Figure 1) with dimensions of the calibrated space structure of x = 4.5 m (horizontal axis); y = 1 m (medial-lateral axis); z = 1.5 m (vertical axis). A light signal, recorded simultaneously by the six cameras, was used to synchronize the images from the video cameras on the same time base as a reference in the reconstruction of the coordinates in the analysis software.
In two laps of T200 (M1, from 75 to 100 m, and M2, from 175 to 200 m), a stroke cycle was analyzed, starting with the entry and re-entry of the same hand into the water (Barbosa et al., 2008). One cycle was used for all swimmers. The chosen cycle was the one in which the swimmers were more centered in the calibration volume space, with the beginning and end of the cycle within the previously calibrated space. The distance traveled by the swimmers within the calibrated space was used for the 3D image analyses. For the swimmers with upper limb amputation, the cycle was adapted to the entry and re-entry from the distal part of the limb into the water. The calibration frame was recorded by the cameras for three seconds before the swimmers started the T200, to provide the spatial parameters for the conversions of the images from two dimensions into three dimensions, with Direct Linear Transformation (DLT) by calculations performed in the Ariel Performance Analysis System (APAS) software. The images were cropped (stretches of swimming in the calibrated space) and converted (AVCHD 1080p to AVI 1,080 × 720 p, uncompressed format) by means of Sony Vegas Pro 15 Software (MAGIX GmbH & Co. KGaA, Germany).
Then, the images were uploaded to the APAS software through trimming, in which were processed to obtain the kinematic and coordinative parameters. The digitalization was manual, at each frame, of the 18 markers on the swimmer’s body (vertex of the head, middle finger, wrist, elbow, shoulder, hip, knee, heel, and first metatarsal phalanx) and a fixed marker in the same place in all frames. At the end of the digitization of each moment—a stroke cycle—24 calibration volume control markers were digitized and used for the transformation from two to three dimensions DLT. Finally, the display was used to identify the displacement results of all the scanned markers for the calculations of the kinematic variables. The frame location of the center of body mass was identified. The data were smoothed by a Butterworth filter with a cut-off frequency of 4 Hz passed low second order. The results were saved in Microsoft Excel spreadsheets and saved in txt format files for the variable calculations.
To evaluate the coordination model and the duration of the stroke phases, the horizontal and vertical coordinates of the hands and shoulders were identified, frame by frame, the beginning and the end of each stroke phase, total propulsive and total non-propulsive, as described below (Chollet et al., 2000):
• Entry and support: time between the entry of the hand into the water until the beginning of the backward movement of the hand or the distal part of the upper limb in the case of swimmers with amputation (phase onset: first frame in which the entry of the hand into the water was identified).
• Pull: time between the beginning of the backward movement of the hand or the amputated arm until it is below the swimmer’s shoulder (beginning of the phase: first frame in which the horizontal coordinate of the hand decreased, after the hand entered the water).
• Push: elapsed time between the time the hand is below the shoulder line to the side of the thigh breaking the surface of the water (phase start: frame in which the vertical coordinates of the shoulder and hand markers were the same).
• Recovery: elapsed time between the hand out of the water and the same hand entering the water in front of the swimmer’s body (phase start: frame that the hand marker appears out of the water).
Kinematic data collection
The s was obtained by the quotient between the horizontal displacement of the center of mass (x-axis) over the stroke cycle and the time to complete the same cycle. The SR was calculated by the inverse of the stroke cycle duration multiplied by 60. The SL was identified by the horizontal displacement of the swimmer’s center of mass during the stroke cycle.
Identification of the coordination model
The coordination model was identified by calculating IdC (for swimmers without upper limb amputation) and IdCAdapt (for the swimmer with upper limb amputation) (Chollet et al., 2000; Osborough et al., 2010). The average duration of each stroke phase was determined after scanning the first two consecutive movements (one of the right arm and one of the left arm) (Chollet et al., 2000). At the time the swimmers entered the calibrated space, such as by the left upper limb, the IdC was defined as the time interval between the end of the push phase of the left upper limb and the beginning of the pull phase of the right (LT1) and the time interval between the end of the push phase of the right upper limb and the beginning of the second phase of the left (LT2) (Chollet et al., 2000). Regardless of which hand enters the pre-calibrated space first, the average delay between the push phases of the two was presented as a percentage of the average time of a complete stroke cycle (T) (Chollet et al., 2000), using Equation 1, to calculate IdC or IdCAdapt:
Equation 1

Thus, when IdC or IdCAdapt were < 0, the coordination model was capture; when IdC or IdCAdapt were = 0, the model was opposition and when IdC or IdCAdapt were > 0, the model was overlapping (Chollet et al., 2000).
Peak oxygen uptake (VO2peak)
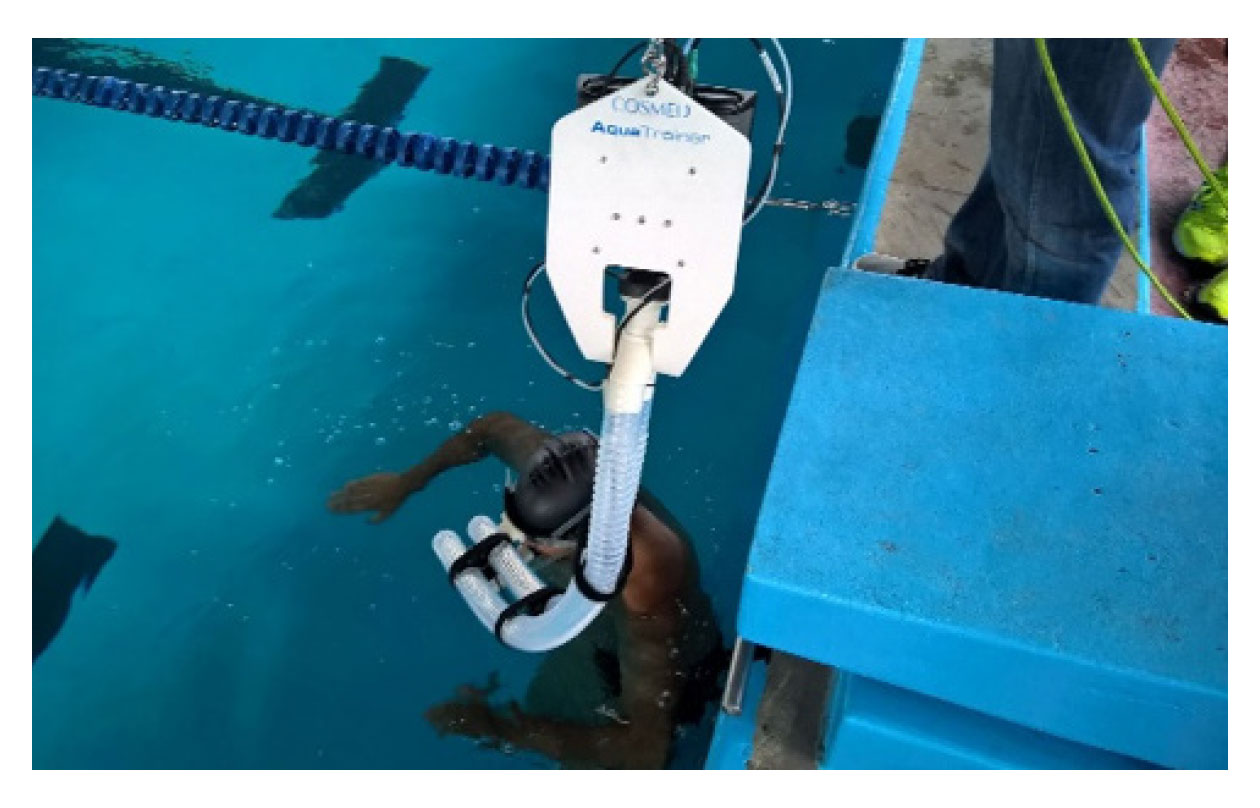
T200 only started when the respiratory exchange rate (RER), identified by the ergospirometer, was close to 0.8. During T200, VO2 and RER were collected in a continuous breath-by-breath mode. Before the beginning of all collections, the ergospirometer was calibrated according to the manufacturer’s instructions. After calibration, it was connected to the athlete by a snorkel for respiratory gas uptake (Figure 2). All this apparatus was suspended at a height of 2 m from the water surface by means of carabiners and steel cable with pulleys, thus making it possible to follow the swimmer along the pool, minimizing the disturbances created to the swimmer’s movements (Sousa et al., 2013). After the test, the oxygen uptake values were manually filtered using the mean ± 4*standard-deviation reference value (De Jesus et al., 2014) to minimize artifacts from gas uptake that does not represent physiological data. The moving average of five breaths was used in the analyses (Fernandes et al., 2011). The VO2peak was considered the highest value identified during the test (Ribeiro et al., 2016).
Statistical analysis
The Shapiro-Wilk normality test was applied. Means, standard deviations, and limits of confidence intervals of the mean (CI 95%) of all variables in this study were calculated. For comparison between the two analyzed 200 m laps, Student’s t-test for paired data was applied. Statistical significance was set at p < .05. The effect size used was Hedge’s g, with the following categorization: 0 to 0.19 trivial; 0.2 to 0.59 small; 0.6 to 1.19 moderate; 1.2 to 1.99 large; 2.0 to 3.99 very large, and > 4 nearly perfect (Hopkins, 2002).
Results
The mean performance on the T200 was 197.8 ± 24.7 s (CI 95%: 171.9 to 223.7 s). By sport class, performance on the T200 was 195 s (S8, n = 1), 192 ± 28.3 s (S9, n = 4), and 221 (S10, n = 1). The VO2peak mean and standard deviation were 44.1 ± 8.4 ml∙kg-1∙min-1 (CI 95%: 35.2 to 53.1 ml∙kg-1∙min-1). Table 1 shows the mean values, standard deviations, and CI 95%, results of the comparisons, and the stretch’s effect sizes in the T200.

Table 1
Mean ± standard deviations, limits of confidence intervals of the mean (95%) and statistical data for s, SR, SL (n = 6), IdC (n = 5) and stroke length phases of stretch 1 and 2 (S1: 75-100; S2: 175-200 m) respectively of T200.
Effect sizes (stretch effects in T200) were (i) trivial for swimming speed, stroke rate, IdC/IdCAdapt, duration of entry and support, and pull phases; and (ii) small for stroke length, duration of pull, push, recovery, propulsive and non-propulsive phases.
Discussion
The present study aimed at describing the performance of swimmers with amputations in the T200, through kinematic and coordination parameters in two stretches of the test and by the peak oxygen uptake. The main findings of this study were that the kinematic variables did not present statistical variations regarding the two stretches analyzed, the coordination was classified as capture and peak oxygen uptake was lower than that found with swimmers without impairment in the same test, by direct method gas exchange system by telemetry (Figueiredo et al., 2013). The effect sizes of the analysis times on the variables were trivial or small.
According to Prins and Murata (2008) and Osborough et al. (2009), swimmers with physical impairments in general, and with upper limb amputation, in particular, to achieve and maintain the desired s, compensate for the lack of the propulsive segment with higher SR values when compared to swimmers without physical impairment. That is, SR plays a more important role in relation to performance than SL. In the present study over 200 m, s and SR statistically remained constant (trivial effect size implied in reduction of s and increase of SR), whereas the SL showed a greater decrease (small effect size). This result supports the importance of SR for swimmers with amputations. It is noteworthy that this behavior was the same for all swimmers in the present study: four with lower limb amputations and two with upper limb amputations. That is, the reduced propulsive capacity of the lower limbs also led to increased SR for the maintenance of s.
Compared to swimmers with typical anatomy, a similar behavior of SR and SL for the 200 m front crawl (increase in SR and decrease in SL throughout the 200 m) was identified in 11 of the 17 swimmers (Huot-Marchand et al., 2005). However, a higher s (1.45 m∙s-1) reached by a higher SL (2.1 m) and similar SR (41.4 cycles∙min-1) in relation to the swimmers of the present study in the same test. At least for swimmers with physical impairments at the national level (100 m freestyle events), SL seems to be more directly related to the s and sport class for the male and female genders (Pérez-Tejero et al., 2018).
Also, in T200 with typical swimmers, Franken et al. (2016) analyzed four 25 m splits before the 50, 100, 150 and 200 m of T200 m, and found an increase only between 50 and 200 m in SR. On the other hand, SL values decreased from 50 m to 200 m. Thus, it can be verified that both, swimmers with impairments and swimmers with typical anatomy, throughout T200, tend to increase SR, while SL decreases, modifying the way the s is reached and maintained over the distance assessed.
Regarding the inter-arm coordination, the effect sizes of the analyzed laps of T200 were trivial for IdC or IdCAdapt and all swimmers, in both stretches of the test, performed the front crawl swimming in capture model. In a T200, among swimmers without impairments, a capture model was observed in the study by Figueiredo et al. (2010), assessing the coordination of six conventional athletes who presented capture coordination during the entire 200 m test. An increase in IdC was also observed in the 4th 50 m partial and this, according to the authors, was attributed to an attempt to maintain s when there is a decrease in SL. Increasing SR is at the expense of reducing the duration of the non-propulsive phases of the strokes, which also leads to a reduction in the time without propulsion. Whereas in the study of Franken et al. (2016) the values of IdC did not change during the analyzed T200 partials. For Franken et al. (2016), only at high s, when SR is high, is there a change from capture model to opposition/overlap.
The behavior of the phases’ duration along the T200 in this study was similar to that found in the literature (Franken et al., 2016). In the same study, no statistical differences were found in the duration of the entry and support, pull, and recovery phases at T200, but an increase in the duration of the pull phase was observed. This increase may be related to the maintenance of body balance and because it is the beginning of the movement that would be more propulsive in front crawl stroke due to the absence of other typical limbs (Santos et al., 2020). The reasons for this imbalance may be a preference for unilateral breathing, strength imbalance between homologous muscle pairs, and motor control deficit. Improving hand speed, and optimizing the pull phase, seems to be a crucial point to be improved among amputee swimmers (Santos et al., 2021).
In relation to VO2peak, it can be verified, for the same T200, reduced values of the present study swimmers (44.1 ± 8.4 ml∙kg-1∙min-1) in comparison to high level swimmers of typical anatomy (68.5 ± 5.7 ml∙kg-1∙min-1) (Sousa et al., 2011), and master swimmers of typical anatomy (52.5 ± 6.3 ml∙kg-1∙min-1) (Trindade et al., 2018). By the amputations, reduced muscle mass causes decreased muscle perfusion, which in turn reduces the VO2 values (Saltin et al., 1998). In this way swimmers with limb amputation have lower VO2peak than those with typical anatomy, even master swimmers. Along with the already lower VO2, the difficulty of swimmers with a deficiency in maintaining maximal aerobic effort is highlighted (Ramos Junior, 2017).
As the main limitation of this study, the sample size can be highlighted. This limitation does not allow extrapolation of the data to all populations of swimmers with physical impairment. However, the results allow for approximations within the context of swimmers with amputations. Future investigations may be carried out with this population for a better understanding of the data with the purpose of helping professionals involved with sports for people with impairment.
Conclusion
The findings of this study indicate that at T200 amputee swimmers tended to modify kinematic variables over times M1 and M2 with an increase in SR and decrease in SL, as well as a decrease in s. The athletes adopted coordination in capture and spent most of it in non-propulsion phase. The peak oxygen uptake was lower than that found with swimmers without impairment in the same test.
Disclosure statement
No funding. The study was approved by the local ethics committee (Comitê de Ética em Pesquisa da Universidade Federal do Rio Grande do Sul – UFRGS, number 2.274.037) and was performed in accordance with the Declaration of Helsinki.
References
[1] Barbosa, T. M., Fernandes, R. J., Keskinen, K. L., & Vilas-Boas, J. P. (2008). The influence of stroke mechanics into energy cost of elite swimmers. European Journal of Applied Physiology, 103(2), 139-149. https://doi.org/10.1007/s00421-008-0676-z
[2] Castro, F. A., Correia, R., Fiori, J. M., Giuliano, A. F., Trindade, C. D. Z., & Feitosa, W. G. (2021). Practical application of the simplified model to assess the arm stroke efficiency: a tool for swimming coaches. International Journal of Performance Analysis in Sport, 1-9. https://doi.org/10.1080/24748668.2021.1957295
[3] Chollet, D., Chalies, S., & Chatard, J. C. (2000). A new index of coordination for the crawl: description and usefulness. International Journal of Sports Medicine, 21(1), 54-59. https://doi.org/10.1055/s-2000-8855
[4] Craig, A. B., Jr., & Pendergast, D. R. (1979). Relationships of stroke rate, distance per stroke, and velocity in competitive swimming. Medicine & Science in Sports, 11(3), 278-283. http://www.ncbi.nlm.nih.gov/pubmed/522640
[5] De Jesus, K., Guidetti, L., de Jesus, K., Vilas-Boas, J. P., Baldari, C., & Fernandes, R. J. (2014). Which are the best VO2 sampling intervals to characterize low to severe swimming intensities? International Journal of Sports Medicine, 35(12), 1030-1036. https://doi.org/10.1055/s-0034-1368784
[6] De Jesus, K., Sousa, A., de Jesus, K., Ribeiro, J., Machado, L., Rodriguez, F., Keskinen, K., Vilas-Boas, J. P., & Fernandes, R. J. (2015). The effects of intensity on VO2 kinetics during incremental free swimming. Applied Physiology, Nutrition, and Metabolism, 40(9), 918-923. https://doi.org/10.1139/apnm-2015-0029
[7] Eston, R., & Really, T. (2009). Kinanthropometry and exercise physiology laboratory manual: tests, procedures and data. R. Eston & T. Really, Eds. 3RD ed., Vol. Volume one: anthropometry. London-New York: Routledge- Taylor and Francis Group.
[8] Feitosa, W. G., Correia, R. A., Barbosa, T. M., & Castro, F. A. S. (2019). Performance of disabled swimmers in protocols or tests and competitions: a systematic review and meta-analysis. Sports Biomechanics, 1-23. https://doi.org/10.1080/14763141.2019.1654535
[9] Fernandes, R. J., Sousa, M., Machado, L., & Vilas-Boas, J. P. (2011). Step length and individual anaerobic threshold assessment in swimming. International Journal of Sports Medicine, 32(12), 940-946. https://doi.org/10.1055/s-0031-1283189
[10] Figueiredo, P., Toussaint, H. M., Vilas-Boas, J. P., & Fernandes, R. J. (2013). Relation between efficiency and energy cost with coordination in aquatic locomotion. European Journal of Applied Physiology, 113(3), 651-659. https://doi.org/10.1007/s00421-012-2468-8
[11] Figueiredo, P., Vilas-Boas, J. P., Seifert, L., Didier, C., & Fernandes, R. (2010). Inter-Limb Coordinative Structure in a 200 m Front Crawl Event. Open Sports Sciences Journal, 3, 25-27. https://doi.org/10.2174/1875399X01003010025
[12] Figueiredo, P., Willig, R., Alves, F., Vilas-Boas, J. P., & Fernandes, R. J. (2014). Biophysical characterization of a swimmer with a unilateral arm amputation: a case study. International Journal of Sports Physiology and Performance, 9(6), 1050-1053. https://doi.org/10.1123/ijspp.2013-0438
[13] Franken, M., Ludwig, R. F., Cardoso, T. P., Silveira, R. P., & Castro, F. A. d. S. (2016). Performance in 200 m front crawl: coordination index, propulsive time and stroke parameters. Revista Brasileira de Cineantropometria e Desempenho Humano, 18,(3), 311-321. https://doi.org/10.5007/1980-0037.2016v18n3p311
[14] Hay, J. G., & Guimarães, A. C. S. (1983). A quantitative look at swimming biomechanics. Swimming Technique, 20(2), 11-17.
[15] Hogarth, L., Payton, C., Van de Vliet, P., Connick, M., & Burkett, B. (2018). A novel method to guide classification of para swimmers with limb deficiency. Scandinavian Journal of Medicine & Science in Sports, 28(11), 2397-2406. https://doi.org/10.1111/sms.13229
[16] Hopkins, W. G. (2002). A scale of magnitudes for the effect statistics. A new view of statistics. http://www.sportsci.org/resource/stats/effect-mag.html.
[17] Huot-Marchand, F., Nesi, X., Sidney, M., Alberty, M., & Pelayo, P. (2005). Variations of stroking parameters associated with 200 m competitive performance improvement in top-standard front crawl swimmers. Sports Biomechanics, 4(1), 89-99. https://doi.org/10.1080/14763140508522854
[18] Osborough, C. D., Payton, C. J., & Daly, D. (2009). Relationships between the front crawl stroke parameters of competitive unilateral arm amputee swimmers, with selected anthropometric characteristics. Journal of Applied Biomechanics, 25(4), 304-312. http://www.ncbi.nlm.nih.gov/pubmed/20095451
[19] Osborough, C. D., Payton, C. J., & Daly, D. (2010). Influence of swimming speed on inter-arm coordination in competitive unilateral arm amputee front crawl swimmers. Human Movement Science, 29(6), 921-931. https://doi.org/10.1016/j.humov.2010.05.009
[20] Payton, C., Hogarth, L., Burkett, B., P, V. D. V., Lewis, S., & Oh, Y. T. (2020). Active Drag as a Criterion for Evidence-based Classification in Para Swimming. Medicine & Science in Sports & Exercise, 52(7), 1576-1584. https://doi.org/10.1249/MSS.0000000000002281
[21] Pelarigo, J. G., Fernandes, R. J., Ribeiro, J., Denadai, B. S., Greco, C. C., & Vilas-Boas, J. P. (2018). Comparison of Different Methods for the Swimming Aerobic Capacity Evaluation. Journal of Strength and Conditioning Research, 32(12), 3542-3551. https://doi.org/10.1519/JSC.0000000000001873
[22] Pelarigo, J. G., Machado, L., Fernandes, R. J., Greco, C. C., & Vilas-Boas, J. P. (2017). Oxygen uptake kinetics and energy system's contribution around maximal lactate steady state swimming intensity. PLoS One, 12(2), e0167263. https://doi.org/10.1371/journal.pone.0167263
[23] Pérez-Tejero, J., Almena, A., Coterón, J., Navandar, A., & Veiga, S. (2018). Freestyle stroke parameters of national level swimmers with physical impairments. Revista Internacional de Ciencias del Deporte, 14(53), 268-279. https://doi.org/10.5232/ricyde
[24] Prins, J., & Murata, N. (2008). Kinematic analysis of swimmers with permanent physical disabilities. International Journal of Aquatic Research Education, 2(4), 330-345.
[25] Ramos Junior, V. R. (2017). Caracterização biofísica de nadadores com deficiência motora. Doctoral Thesis, University of Porto, Portugal.
[26] Ribeiro, J., Figueiredo, P., Guidetti, L., Alves, F., Toussaint, H., Vilas-Boas, J. P., Baldari, C., & Fernandes, R. J. (2016). Aquatrainer(R) snorkel does not increase hydrodynamic drag but influences turning time. International Journal of Sports Medicine, 37(4), 324-328. https://doi.org/10.1055/s-0035-1555859
[27] Saltin, B., Radegran, G., Koskolou, M. D., & Roach, R. C. (1998). Skeletal muscle blood flow in humans and its regulation during exercise. Acta Physiologica Scandinavica, 162(3), 421-436. https://doi.org/10.1046/j.1365-201X.1998.0293e.x
[28] Sanders, R. H., Chiu, C. Y., Gonjo, T., Thow, J., Oliveira, N., Psycharakis, S. G., Payton, C. J., & McCabe, C. B. (2015). Reliability of the elliptical zone method of estimating body segment parameters of swimmers. Journal of Sports Science and Medicine, 14(1), 215-224. http://www.ncbi.nlm.nih.gov/pubmed/25729310
[29] Santos, K. B., Bento, P. C. B., Payton, C., & Rodacki, A. L. F. (2020). Symmetry in the front crawl stroke of different skill level of able-bodied and disabled swimmers. PLoS One, 15(3), e0229918. https://doi.org/10.1371/journal.pone.0229918
[30] Santos, K. B., Bento, P. C. B., Payton, C., & Rodacki, A. L. F. (2021). Kinematic Variables of Disabled Swimmers and Their Correlation With the International Paralympic Committee Classification. Motor Control, 25(4), 575-586. https://doi.org/10.1123/mc.2021-0019
[31] Sousa, A., Figueiredo, P., Oliveira, N. L., Oliveira, J., Silva, A. J., Keskinen, K. L., Rodriguez, F. A., Machado, L. J., Vilas-Boas, J. P., & Fernandes, R. J. (2011). VO2 kinetics in 200-m race-pace front crawl swimming. International Journal of Sports Medicine, 32(10), 765-770. https://doi.org/10.1055/s-0031-1279772
[32] Sousa, A., Figueiredo, P., Zamparo, P., Vilas-Boas, J. P., & Fernandes, R. J. (2013). Anaerobic alactic energy assessment in middle distance swimming. European Journal of Applied Physiology, 113(8), 2153-2158. https://doi.org/10.1007/s00421-013-2646-3
[33] Toussaint, H. M., & Beek, P. J. (1992). Biomechanics of competitive front crawl swimming. Sports Medicine, 13(1), 8-24. http://www.ncbi.nlm.nih.gov/pubmed/1553457
[34] Trindade, C. D. Z., Schneider, C. D., & Castro, F. A. S. (2018). Physiological and kinematic analysis of master swimmers 200 m front crawl. Revista Portuguesa de Ciências do Desporto, 18, 46-61. https://doi.org/10.5628/rpcd.18.03.46
[35] Yanai, T. (2003). Stroke frequency in front crawl: its mechanical link to the fluid forces required in non-propulsive directions. Journal of Biomechanics, 36(1), 53-62. http://www.ncbi.nlm.nih.gov/pubmed/12485638
ISSN: 2014-0983
Received: December 5, 2022
Accepted: March 10, 2023
Published: October 1, 2023
Editor: © Generalitat de Catalunya Departament de la Presidència Institut Nacional d’Educació Física de Catalunya (INEFC)
© Copyright Generalitat de Catalunya (INEFC). This article is available from url https://www.revista-apunts.com/. This work is licensed under a Creative Commons Attribution-NonCommercial-NoDerivatives 4.0 International License. The images or other third party material in this article are included in the article’s Creative Commons license, unless indicated otherwise in the credit line; if the material is not included under the Creative Commons license, users will need to obtain permission from the license holder to reproduce the material. To view a copy of this license, visit https://creativecommons.org/licenses/by-nc-nd/4.0/deed.en


