Penetrative Passing Patterns: Observational Analysis of Senior UEFA and FIFA Tournaments
Júlia Zani
Tiago Fernandes
Rodrigo Santos
Daniel Barreira
*Corresponding author: Júlia Zani juliazani12@gmail.com
Cite this article
Zani, J., Fernandes, T., Santos R. & Barreir, D. (2021) Penetrative Passing Patterns: Observational Analysis of Senior UEFA and FIFA Tournaments. Apunts Educación Física y Deportes, 146, 42-51.
https://doi.org/10.5672/apunts.2014-0983.es.(2021/4).146.05
Abstract
This study aimed to identify the most frequent behavioural, structural and interactional variables that induced three types of penetrative passing that generated goal-scoring chances in elite soccer. Following restrict inclusion criteria (each and every type of pass that disrupts the opposition’s last defensive line), 134 attacking sequences from UEFA Euro 2016, 2017 FIFA Confederations Cup, and 2018 FIFA World Cup, were sampled. The PePas observational instrument – which integrates previous validated criteria – was used to analyse the penetrative passes. Moreover, the proportion z-test was performed to verify whether the proportions of tactical and technical behaviours differed from the others (α⊇=⊇.05). The results showed that ball control and running with the ball were the most frequent behaviours before the short penetrative pass preceded by an individual action, and the short pass was the most frequent behaviour that preceded the short penetrative pass preceded by a collective action. All tactical-technical behaviours occurred in an interactional context of no pressure and mostly in the pitch’s central paths. Further, ball control was significantly different from the other categories in the long penetrative pass preceded by an individual action. We suggest that coaches consider replicating scenarios with no pressure of the defence and include activities that encourage tactical-technical behaviours such as running with the ball and quick exchange of passes with one and two touches.
Introduction
Soccer is a game with a complex and dynamical nature, characterised by the interaction between two teams in opposing relationship. This relationship constantly and simultaneously prompts order and disorder during a match (Gréhaigne et al., 1997).
Soccer match analysis is considered an essential tool for coaches and players due to the potential insights it often provides for practice (Lames & Hansen, 2001). Accordingly, gathering information from the game regarding the temporal sequence of events might contribute to the design of more representative training activities to simulate typical situations in actual competitive settings (Pfeiffer & Perl, 2006). Moreover, it seems relevant to understand which events are more likely to lead to successful attacking plays, i.e., the behaviours that induce the critical events that characterise an attacking sequence.
Goal-scoring has been largely investigated in sports science literature, and studies have indicated that more scoring opportunities are created when players are inside the box (e.g., González-Ródenas et al., 2020) due to the proximity to the opposing goal. Also, after an assist, more than 60% of the goals were scored in a first-touch shot, i.e., with no contact with the ball before the shot (González-Ródenas et al., 2020). The authors have also emphasised the importance of penetrative passes to create goal-scoring opportunities (González-Ródenas et al., 2020). This critical event can be defined as a perturbation, i.e., an external force that causes a disturbance in the system, forcing it to reorganise itself towards an attractor or moving the system towards a new attractor (Gorman et al., 2017). Robins and Hughes (2015) maintain that perturbations are associated with the destabilisation of the opposing team’s dynamic organisation/coordination, and are defined by incidents (e.g., penetrative passing, dribbling, changing of pace) capable of modifying the regular flow of the game, resulting in a clear scoring opportunity.
In this sense, to the best of our knowledge, only one study (Zani et al., 2021) analysed the types of penetrative passes – “here conceived as the last pass of the sequence of play that disrupts the opponent’s last defensive line (i.e., a pass played into the space behind the last defensive line), performed by an attacking player and successfully received by a teammate who either performs the last action of the sequence of play in front of the goalkeeper (e.g., first-touch shot), or maintains ball possession until the last action (e.g., ball reception, dribble and shot), which generates a goal-scoring opportunity”). The authors found that the penetrative short pass preceded by an individual action was the most frequent, followed by penetrative long pass preceded by an individual action, and penetrative short pass preceded by a collective play. However, in our perspective, it is relevant to comprehend how the aforementioned penetrative passing leading to goal-scoring opportunities are induced concerning the tactical and technical behaviours, the interactional conditions among players, and the locations where the actions more frequently take place.
Thus, we aim to identify the most frequent behavioural (i.e., tactical-technical behaviours of the attacking and defending teams and players), structural (i.e., pitch locations) and interactional (i.e., the interactions between attacking and defending players) variables that induced each type of penetrative passing that generated goal-scoring chances in soccer.
Methods
Observational Design
The observational design followed the specific taxonomy used (Anguera et al., 2011). The nomothetic criteria were represented by analysing different national teams in the UEFA Euro 2016, 2017 FIFA Confederations Cup, and 2018 FIFA World Cup tournaments (see Table 1). The follow-up criteria were configured through a sequential analysis of the events (starting from the action that preceded the penetrative pass until the end of the offensive phase) using an observational instrument called PePas (Table 2), that includes multiple criteria and responses (multidimensional concept).
Participants
All matches were obtained from the InStat Scout® platform. A search was made and included all the 227 matches played from the group stage to final matches in the UEFA Euro 2016, 2017 FIFA Confederations Cup, and 2018 FIFA World Cup. One hundred and thirty-four attacking sequences with a penetrative pass in behind the opponent’s last defensive line were sampled and met the inclusion and analysis criteria. Although the number of sequences may seem limited, the specific nature of the events being studied, as well as the number and significance of the tournaments we analysed, justifies the size of the sample. The number of attacking sequences according to the stage of the competition was as follows: 92 in the group stage; 20 in the round of 16; 4 in the quarter-finals; 11 on the semi-finals; 3 in the finals; and 4 in the third-place matches. Out of 134 attacking sequences, 120 included the three types of penetrative passes analysed in the present work.

Table 1
National teams that performed penetrative passes during either the 2016 UEFA Euro, and/or the 2017 FIFA Confederations Cup, and/
or 2018 FIFA World Cup.
Instruments
Observational instrument
Initially, the researchers screened the video footage of the matches to verify the incidence of penetrative passes (as previously described) in the three international tournaments (2016 UEFA Euro, 2017 FIFA Confederations Cup and 2018 FIFA World Cup) with the purpose of registering the variables that could ascertain the aspects that characterised the period from the action that preceded the penetrative pass up to the conclusion of the sequence of play. Following this procedure, The PePas observational instrument was designed using criteria and/or categories of other previously published tools (Barreira et al., 2013; Fernandes et al., 2019) that integrate teams’ offensive and defensive technical and tactical behaviours, thus uncovering the structural, behavioural and interactional contexts of the game (Table 2). This instrument includes 9 criteria and 93 categories, namely four behavioural (attacking team, criteria 1, 2, 3 and 6; defending team, criteria 4 and 5), two interactional (criteria 8 and 9) and one structural (criterion 7) variables. For the present investigation, criteria 1, 2, 4, 5, 7, 8 and 9 were used.
Data Collection Software
The Lince v1.3 software was used to collect data. It allows data encoding, video analysis, data quality estimation, and data exporting from file formats used by other analysis software (Gabin et al., 2012).
Procedures
We performed an analysis of the ball recovery or ball development before the last pass (criterion 1) and their correspondent structural (criterion 7) and interactional (criteria 4, 5, 7, 8 and 9) variables, for each type of the following penetrative passes (criterion 2): (i) penetrative short pass preceded by an individual action (PPspia); (ii) long penetrative pass preceded by an individual action (PPlpia); and (iii) short penetrative pass preceded by a collective action (PPspca).
Data quality
The Lince software comprises systems of analysis that enable the design of observational instruments, inclusion of video files and data collection through notational analysis. In addition, analysis can be saved in, and loaded from specific folders, which can then be compared. Intra-observer reliability was calculated using Cohen’s Kappa (k) (Cohen, 1960) through the Lince v1.3 software. A 30% (n = 35) of the sample was observed twice by the same observer with an interval of fifteen days. The values of k ranged between 0.86 and 1.00. These values are classified as almost perfect (0.81-1.00) by literature (Bakeman & Gottman, 1997).
Data Analysis Software
Orange: Data Mining Toolbox in Python v3.22. (Demšar et al., 2013) was used to explore and visualise data; and RStudio v1.2.1335 (R Core Team, 2019) for statistical analysis.
Statistical analysis
It was made an exploratory analysis through data visualisation and contingency tables. In most of the cells, the expected count was less than the minimum expected (Rothman et al., 2008). Thus, we utilised the sub-criteria (see Table 2) of the following criteria: first defender tactical-technical actions (DD); second defender tactical-technical actions (DI), centre of the game (CJ) and spatial pattern of interaction between teams (CEI). As for the pitch zones, we grouped the central zones of the same sectors (i.e., central zones 3 and 4; 7 and 8; and so on). Subsequently, we applied the proportion z-test, specifically to the groups with a sufficiently large number of events, i.e., n > 5 (Montgomery & Runger, 2003), to test the hypothesis that the proportion of a group is statistically greater than another one within the same criterion. The significance level was set at p < .05.
Results
Behavioural variables of the attacking team
Table 3 shows that ball recovery or ball development before the last pass by reception/control (RDBbc) tended to occur more often in the penetrative short pass preceded by an individual action (PPspia, n = 39) and in long penetrative pass preceded by an individual action (PPlpia, n = 21), although in the PPspia it did not display statistical differences when compared to ball recovery or ball development before the last pass by running with the ball RDBrb (n = 30, p = .09). On the other hand, ball recovery or ball development before the last pass by a short pass (RDBsp) was the most predominant action that preceded the short penetrative pass preceded by a collective action (PPspca, n = 13).
Behavioural variables of the defending team
As Table 4 shows, the ball recovery or ball development before the last pass by ball control (RDBbc) in the PPspia showed that the most frequent actions of the first defender (DD) were defensive recovery (n = 20), as their occurrence was significantly higher than defensive vigilance (n = 11, p = .04) and defensive space management (n = 6, p = .001). As for the second defender (DI), the defensive space management (n = 21) occurred significantly more often than defensive recovery (n = 5, p < .05) and defensive vigilance (n = 7, p = .002).
Following the tendency of ball development before the last pass by ball control (RDBbc), the results of ball development before the last pass by running with the ball (RDBrb) also revealed that defensive recoveries (n = 16) were the most frequent actions. However, in this case, no significant differences were found in the comparison with defensive vigilance (n = 13, p = .31). The second defender’s (DI) most frequent actions were defensive space management (n = 17), which were significantly more frequent than defensive recovery (n = 5, p = .002) and defensive vigilance (n = 7, p = .01).
As for the long penetrative pass preceded by an individual action (PPlpia), Table 3 shows that the DD’s most frequent actions were defensive space management (n = 11), although no significant differences were found in comparison with defensive recovery (n = 9; p = .378). Similarly, the DI concentrated most actions on the defensive space management cluster (n = 14), and their frequency was significantly higher than defensive recovery (n = 5; p = .006).
Regarding the PPspca, defensive space management was the most common action in both DD and DI (n = 6). With respect to the centre of the game (CJ), the results showed that the context of no pressure (n = 12) occurred more often than the context of pressure (n = 1).
Interactional variables
In the short penetrative pass preceded by an individual action (PPspia), the centre of the game (CJ) revealed that, for both RDBbc and RDBrb, a context with no pressure (n = 37 and 28, respectively) was more frequent than the context of pressure (n = 2 in both cases). With respect to the spatial patterns of interaction between teams (CEI), it was observed that the RDBbc was significantly more frequent in the rapport of forces against the back line (n = 21) when compared to the mid line (n = 9, p = .01).
On the other hand, when running with the ball (RDBrb), the rapport of forces versus the mid line (n = 21) occurred more often than the one against the back line (n = 18), although this difference was not statistically significant (p = .31).
Regarding the long penetrative pass preceded by an individual action (PPlpia), the results of CJ revealed that the context with no pressure occurred in 100% of the cases (n = 21). As for the CEI, the most frequent rapport of forces occurred versus the middle line (n = 13), and it occurred significantly more often in comparison with the offensive line (n = 6; p = .03).
As for the short penetrative pass preceded by a collective action (PPspca), the spatial pattern of interaction between teams (CEI) displayed more rapports of forces versus the back line of the opposing team (n = 7), despite the absence of significant differences, when compared to the mid line (n = 6; p = .5).
Table 4
Behavioural and interactional variables according to the type of ball recovery or ball development before the last pass (RDB) for each
type of penetrative pass.
Structural variables
As shown in Figure 1, RDBbc that preceded the PPspia occurred predominantly in three central sectors of the pitch, which were central offensive sector 1 (COS1, n = 9), central offensive sector 2 (COS2, n = 9) and central ultra-offensive sector 1 (CUOS1, n = 9). Altogether, the central offensive sectors (COS1 and COS2, n = 18) displayed statistically higher proportion when compared to ultra-offensive sectors (CUOS1 and CUOS, n = 10), p = .049.
As for the RDBrb, as with the RDBbc, it was observed that the central offensive sectors were predominant (COS1 and COS2, n = 15) for this type of action, and it displayed significant differences in comparison with ultra-offensive sectors (CUOS1 and CUOS 2, n = 7, p = .03). The central offensive sector 2 (COS2, n = 9) was the most predominant, although differences to COS1 and CUOS1 (both n = 6) were not significant (p = .27).
According to Figure 1, before the PPlpia, both the central defensive sector (CDS, n = 7) and central midfield sector 1 (CMS1, n = 7) displayed the highest number of ball control (RDBbc), followed by the central offensive sector 1 (COS1, n = 4).
Regarding the RDBsp in the PPspca, COS2 had the highest frequency (n = 3) of RDBsp. The central sectors presented, altogether, nine occurrences, whereas this behaviour was observed three times in the right-wing, and only one in the left-wing.
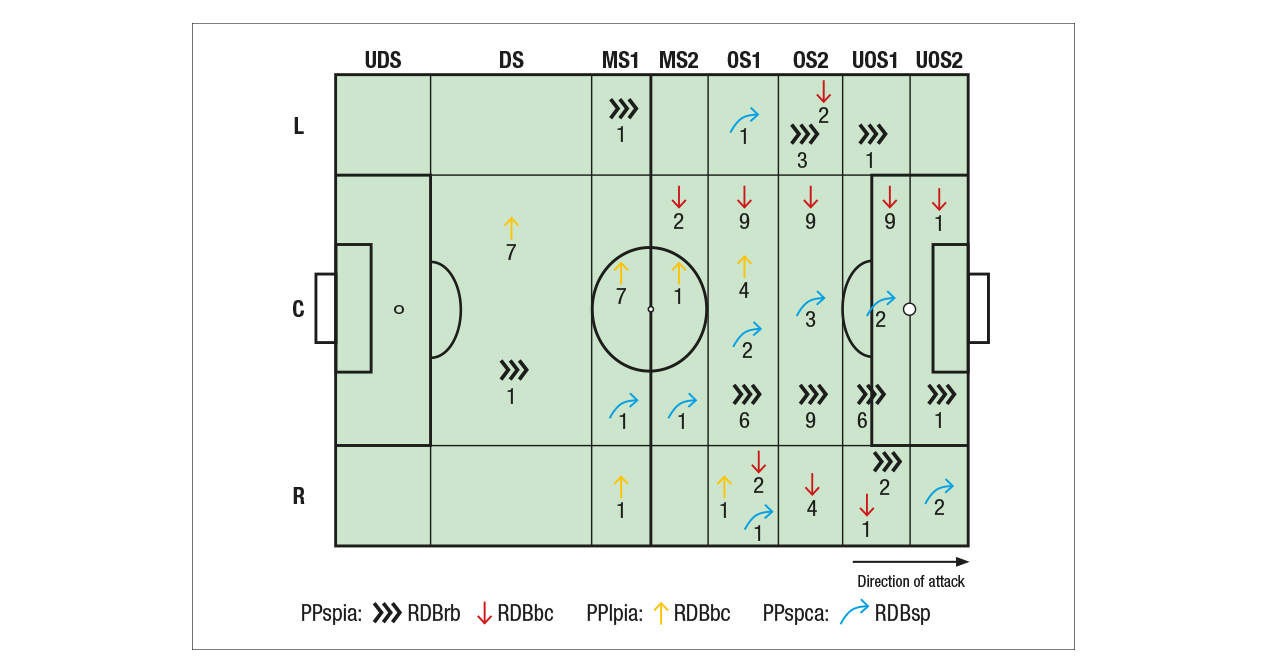
Note. RDBbc = Ball recovery or ball development before the last pass by ball control; RDBrb = Ball recovery or ball development before the last pass by running with the ball; RDBsp = Ball recovery or ball development before the last pass by a short pass; L = Left; C = Central; R = Right; UDS = Ultra defensive sector; DS = Defensive sector; MS1 = Middle sector 1; MS2 = Middle sector 2; OS1 = Offensive sector 1; OS2 = Offensive sector 2; UOS1 = Ultra offensive sector 1; UOS2 = Ultra offensive sector 2. PPspia = Short penetrative pass preceded by and individual action; PPlpia = Long penetrative pass preceded by an individual action; PPspca = Short penetrative pass preceded by a collective action.
Discussion
The present research aimed to identify the most frequent behavioural, structural and interactional variables that induced three types of penetrative passes (PPspia, PPlpia and PPspca), which generated goal-scoring chances in soccer. Ball control and running with the ball were the most frequent actions, and they occurred in a context of no pressure. Some published works (e.g., González-Ródenas et al., 2020) identified the types of assists, but none of them identified the action that preceded the assist action, which precludes comparison with the results of the present study.
Our findings showed that the PPspia was characterised by two types of ball recovery or ball development before the penetrative last passes which were significantly more frequent than the others: (i) ball control; and (ii) running with the ball. Barreira et al. (2014) reported that attacking patterns have changed over the years, shifting from individual actions such as running with the ball and dribbling in the central corridors of the pitch, to collective actions along the lateral paths. In addition, the density of players near the ball has similarly increased. The explanation for the fact that the results of the present work differ from those of the aforementioned study could be related to the style of play or strategy adopted by the teams to use penetrative actions to explore critical spaces of the opposing team, such as the central corridors of the pitch near the goal. In this sense, the type of play is likely to influence the attacking phase, as indicated by González-Ródenas et al. (2020), who identified that counterattack is an effective way to produce scoring opportunities, probably because the attacking team often exploits an imbalanced defence. The lack of defensive organisation in certain moments of the game might explain the results regarding the RDBbc and RDBrb in risky locations of the pitch, especially the central offensive sectors, in a context of no pressure (p < .05). According to Silva et al. (2005), running with the ball appears to be an essential action to turn less favourable attacking scenarios into contexts more susceptible to afford scoring opportunities and disrupt the defensive organisation.
Also, Tenga et al. (2017) suggested that when resorting to penetrative actions, either by a pass or running with the ball, exploiting vulnerable spaces within and behind the last defensive line is an important indicator of success in the attacking phase. In that perspective, our results showed that for both RDBbc and RDBrb, the most frequent tactical-technical actions of the DD were defensive recovery – which means that the player in possession had enough time and space – and defensive vigilance; while the second defender (DI) performed defensive space management in most of the observed sequences. In 1v1 sub-phases, at critical values of interpersonal distance, the attacker-defender dyad can be destabilised by the attackers if they change the difference between the defender’s speed and their own, which can modify the structural organisation of the system (Duarte et al., 2010).
With respect to the CEI, the rapport of forces in the RDBbc was significantly higher (p < .05) against the back line. Regarding the RDBrb, no significative difference was observed between the rapport of forces against the mid line and back line. As for the RDBbc sequences, it is relevant to hypothesise the occurrence of a quick change of passes until the final action, due to the proximity to the goal.
As reported throughout this study, RDBbc preceded the PPspia in considerably favourable conditions in most analysed sequences, either by behavioural or interactional variables. These results corroborate with the findings of Castañer et al. (2017), which indicated that expert players, such as those participating in the elite competitions analysed in the present study, are able to frequently create conditions, in time and space, to play in no-pressure contexts. According to Amatria et al. (2019), in order to reduce opponents’ density in the central zones of the pitch, the Spanish team strategically favoured breadth over depth in the attacking phase, as a means to achieve offensive success.
Although our findings also reinforce that short penetrative passes lead to more scoring opportunities, long penetrative passes also proved to be important actions to disrupt the defensive organisation. The most frequent action that preceded the PPlpia was RDBbc, having most frequently occurred in the central defensive sector and the central middle sector 1, in a context of no pressure. Also, the rapport of forces against the mid line was significantly higher (p < .05) than the others, suggesting that the opposing team could apply pressure high up or in the middle of the field, which opens space between the goalkeeper and the last defensive line. It could be a strategic opportunity to exploit it, especially because both defenders’ tactical-technical actions were defensive space management, which indicates that the defenders could be reducing space between the lines (either transversal or longitudinal) controlling their position or performing a zonal covering.
As for the RDB in the PPspca, short passes were more frequent than long passes, and occurred in the central sectors of the pitch more often than in the wings. In addition, the most common rapport of forces was against mid line and back line.
Conclusion
In conclusion, three types of RDB preceded the three types of PP: ball control, running with the ball and short pass. Most of the actions occurred in the central sectors of the pitch, especially in both the central offensive sectors. The rapport of forces mostly occurred against back line and mid line, and when defenders were not pressing the attackers. The present study provides relevant insights to soccer coaches, as there seems to be a limitation in the literature regarding the actions that precede a final pass. The use of this information in training sessions could help improve the quality of behaviours and the team’s attacking effectiveness.
Despite the relevant contributions, this paper has limitations. Some groups did not achieve the expected numbers of events, which prevented the comparison with others. Future studies could benefit from the analysis of the entire offensive sequence, in order to identify more relevant aspects that are likely to influence the execution of penetrative passes (e.g., type of attack, playing style, ball recovery). Thus, it would be important to gather detailed information to support the design of training activities to encourage players to perform penetrative passes in the attacking phase or to avoid them during the defensive phase.
As for the practical implications, our findings showed the importance of taking advantage of the moments when the opposing team is performing low pressure (by quickly moving the ball away from pressure zones and creating an imbalance for the opponent’s defence), and when actions are more likely to occur before a penetrative pass in behind the last defensive line. Therefore, coaches could design activities that replicate scenarios of no pressure from the defence, especially in the central sectors of the pitch, while the attacking players should coordinate their movements to create space to the player in possession and for the other teammates to receive the penetrative pass. Activities that encourage running with the ball and quick exchange of passes (either with one touch or two) could also deliver effective results.
Funding
The authors gratefully acknowledge the support of a Spanish government subproject Mixed method approach on performance analysis (in training and competition) in elite and academy sport [PGC2018-098742-B-C33] (2019-2021) [del Ministerio de Ciencia, Innovación y Universidades (MCIU), la Agencia Estatal de Investigación (AEI) y el Fondo Europeo de Desarrollo Regional (FEDER)], that is part of the coordinated project New approach of research in physical activity and sport from mixed methods perspective (NARPAS_MM) [SPGC201800X098742CV0].
References
[1] Anguera, M. T., Blanco-Villaseñor, A., Hernandez Mendo, A., & Losada, J. (2011). Diseños observacionales: ajuste y aplicación en psicología del deporte. Cuadernos de Psicología del Deporte, 11(2), 63-76.
[2] Amatria, M., Maneiro, R., & Anguera, M. T. (2019). Analysis of the Success of the Spanish National Team in UEFA-Euro 2012. Apunts Educación Física y Deportes, 137, 85-102. https://doi.org/10.5672/apunts.2014-0983.es.(2019/3).137.03
[3] Bakeman, R., & Gottman, J. M. (1997). Observing interaction: An introduction to sequential analysis. Cambridge University Press.
[4] Barreira, D., Garganta, J., Castellano, J., & Anguera, M. T. (2013). SoccerEye: A software Solution to Observe and Record Behaviours in Sports Settiings. The Open Sports Sciences Journal, 6, 47-55. https://doi.org/10.2174/1875399X01306010047
[5] Barreira, D., Garganta, J., Castellano, J., Prudente, J., & Anguera, M. T. (2014). Evolución del ataque en el fútbol de élite entre 1982 y 2010: Aplicación del análisis secuencial de retardos. Revista de Psicología del Deporte, 23(1), 139-146.
[6] Castañer, M., Barreira, D., Camerino, O., Anguera, M. T., Canton, A., & Hileno, R. (2016). Goal Scoring in Soccer: A Polar Coordinate Analysis of Motor Skills Used by Lionel Messi. Frontiers in Phychology, 7(806). doi.org/10.3389/fpsyg.2016.00806
[7] Castañer, M., Barreira, D., Camerino, O., Anguera, M. T., Fernandes, T., & Hileno, R. (2017). Mastery in Goal Scoring, T-Pattern Detection, and Polar Coordinate Analysis of Motor Skills Used by Lionel Messi and Cristiano Ronaldo. Frontiers in Psychology, 8(741). https://doi.org/10.3389/fpsyg.2017.00741
[8] Cohen, J. (1960). A coefficient of agreement for nominal scales. Educational and Psychological Measurement, 20(1), 37-46. https://doi.org/10.1177/001316446002000104
[9] Demšar, J., Curk, T., Erjavec, A., Gorup, C., Hocevar, T., Milutinovic, M., Možina, M., Polajnar, M., Toplak, M., Staric, A., Štajdohar, M., Umek, L., Žagar, L., Žbontar, J., Žitnik, M., Zupan, B. (2013). Orange: data mining toolbox in Python. The Journal of Machine Learning Research, 14(1), 2349-2353. https://doi.org/10.11114/jets.v7i2.3998
[10] Duarte, R., Araújo, D., Gazimba, V., Fernandes, O., Folgado, H., Marmeleira, J., & Davids, K. (2010). The Ecological Dynamics of 1v1 Sub-Phases in Association Football. The Open Sports Sciences Journal, (3), 16-18. https://doi.org/10.2174/1875399X010030100016.
[11] Fernandes, T., Camerino, O., Garganta, J., Pereira, R., & Barreira, D. (2019). Design and validation of an observational instrument for defence in soccer based on the Dynamical Systems Theory. International Journal of Sports Science & Coaching, 14(2), 138-152. https://doi.org/10.1177/1747954119827283
[12] Gabin, B., Camerino, O., Anguera, M. T., & Castañer, M. (2012). Lince: multiplatform sport analysis software. Procedia- Social and Behavioral Sciences, 46, 4692-4694. https://doi.org/10.1016/j.sbspro.2012.06.320
[13] González-Ródenas, J., López-Bondia, I., Aranda-Malavés, R., Tudela, A., Sanz-Ramírez, E., & Aranda, R. (2020). Technical, tactical and spatial indicators related to goal scoring in European elite soccer. Journal of Human Sport & Exercise, 20(2), 280-293. https://doi.org/10.1080/24748668.2020.1743163
[14] Gorman, J. C., Dunbar, T. A., Grimm, D., & Gipson, C. L. (2017). Understanding and modeling teams as dynamical systems. Frontiers in Psychology, 8(1053). https://doi.org/10.3389/fpsyg.2017.01053
[15] Gréhaigne, J.-F., Bouthier, D., & David, B. (1997). Dynamic-system analysis of opponent relationships in collective actions in soccer. Journal of Sports Sciences, 15(2), 137-149. https://doi.org/10.1080/026404197367416
[16] Lames, M., & Hansen, G. (2001). Designing observational systems to support top-level teams in game sports. International Journal of Performance Analysis in Sport, 1(1), 83-90. https://doi.org/10.1080/24748668.2001.11868251
[17] Melo, L. (2017). Organización ofensiva en el juego del fútbol. Indicadores de los momentos de acelaración en los equipos de Fútbol de Alto rendimento [Master’s thesis, University of Porto]. Open Repository of the University of Porto. https://hdl.handle.net/10216/107699
[18] Montgomery, D. C., & Runger, G. C. (2003). Applied statistics and probability for engineers. John Wiley & Sons, Inc.
[19] Pfeiffer, M., & Perl, J. (2006). Analysis of tactical structures in team handball by means of artificial neural networks. International Journal of Computer Science in Sport, 5(1), 4-14.
[20] R Core Team (2019). R: A language and environment for statistical computing. R foundation for Statistical Computing. https://www.R-project.org/
[21] Robins, M., & Hughes, M. (2015). Dynamic systems and ‘perturbations’. In M. Hughes & I. Franks (Eds.), Essentials of Performance Analysis in Sport (2 ed.). Routledge.
[22] Rothman, K. J., Greenland, S., & Lash, T. L. (2008). Modern Epidemiology. Wolters Kluwer Health/Lippincott Williams & Wilkins.
[23] Silva, A., Sánchez Bañuelos, F., Garganta, J. & Anguera, M.T. (2005). Patrones de juego en el fútbol de alto rendimiento. Análisis secuencial del proceso ofensivo en el Campeonato del Mundo Corea-Japón 2002. Cultura, Ciencia y Deporte, 1(2), 65-72. https://doi.org/10.12800/ccd.v1i2.95
[24] Tenga, A., Mortensholm, A., & O’Donoghue, P. (2017). Opposition interaction in creating penetration during match play in elite soccer: evidence from UEFA champions league matches. International Journal of Performance Analysis in Sport, 17(5), 802-812. https://doi.org/10.1080/24748668.2017.1399326
[25] Zani, J., Fernandes, T., Santos, R., & Barreira, D. (in review). Penetrative pass as a performance indicator in soccer: evidence from FIFA and UEFA international tournaments. Proceedings of the Institution of Mechanical Engineers, Part P: Journal of Sports Engineering and Technology.
ISSN: 2014-0983
Received: 26 de enero de 2021
Accepted: 29 de abril de 2021
Published: 1 de octubre de 2021
Editor: © Generalitat de Catalunya Departament de la Presidència Institut Nacional d’Educació Física de Catalunya (INEFC)
© Copyright Generalitat de Catalunya (INEFC). This article is available from url https://www.revista-apunts.com/. This work is licensed under a Creative Commons Attribution-NonCommercial-NoDerivatives 4.0 International License. The images or other third party material in this article are included in the article’s Creative Commons license, unless indicated otherwise in the credit line; if the material is not included under the Creative Commons license, users will need to obtain permission from the license holder to reproduce the material. To view a copy of this license, visit https://creativecommons.org/licenses/by-nc-nd/4.0/deed.en


