Offensive Performance Indicators of the Spanish Women’s Handball Team in the Japan 2019 World Cup
José Flores-Rodríguez

José Ramón Alvite-de-Pablo
*Corresponding author: José Flores-Rodríguez josefloresrodriguez@live.com
Cite this article
Flores-Rodríguez, J. & Alvite-de-Pablo, J. R. (2023). Offensive Performance Indicators of the Spanish Women’s Handball Team in the Japan 2019 World Cup. Apunts Educación Física y Deportes, 152, 70-81. https://doi.org/10.5672/apunts.2014-0983.es.(2023/2).152.08
Summary
The main objective of this study was to identify the positional attack performance indicators of the Spanish handball team during the World Championship in Japan 2019, in which they were runners-up. Using an idiographic, observational, follow-up and multidimensional design, positional attacks played with equal numbers of 6 vs. 6 were recorded and analysed, excluding attacks carried out with an empty goal. The polar coordinates technique made it possible, on the one hand, to identify behavioural patterns and, on the other, performance indicators related to: the continuity of attack, the situations used to generate imbalances in the opposing defence, and the actions involved in the completion of the attack. For this purpose, two levels of analysis were carried out: each match independently and all matches together. The results obtained show that each match presented its own specific game dynamics, as different behavioural patterns were triggered and different performance indicators emerged depending on the match. These findings highlight the variability and dynamic nature of the offensive behaviours and performance indicators of the World Cup runners-up team. The need to study performance indicators through research that respects their specific and changing nature is emphasised.
Introduction
Performance indicators are game variables that are associated with victory in a match or championship (Hughes & Bartlett, 2002). In the field of handball, the compilation of performance indicators is a matter of great interest for coaches and researchers, as they provide performance profiles that teams aim to approximate, and provide information on game development from one championship to the next (Prieto, 2015).
Two research approaches are identified in handball: static and dynamic (Prieto et al., 2015). The static approach is the most common and also the least complex. It mainly analyses actions performed during attack, such as shots or turnovers, focusing on events that occurred and paying limited attention to how they happened (Sampaio et al., 2013). The dynamic approach is less common. It focuses more attention on the context in which actions occur (Prieto et al., 2015), studying the influence of game systems (Lozano et al., 2016) or how the presence of a certain player conditions the development of the game (Flores & Anguera, 2018). In addition, actions are studied in the chronological order in which they occurred, which provides insight into the changes that occur in the game within a single match (Lames, 2006; Lames & McGarry, 2007).
Whether using the static or the dynamic approach, most performance indicators give a fixed snapshot, a kind of general rule of thumb that winning teams always follow. These indicators are derived from the analysis of data obtained at the end of one or several matches, whether they are performed by a single team or by all the teams participating in the competition (Gruić et al., 2006; Meletakos & Bayios, 2010; Meletakos et al., 2011; Montoya et al., 2013; Ohnjec et al., 2008; Rogulj et al., 2004; Srhoj et al., 2001; Volossovitch et al., 2010; Vuleta et al., 2003).
However, the fixed snapshot of performance indicators can be problematic: (a) Teams change the way they play during the course of a championship and also within a single match. Coaches vary their strategic approach depending on the opposing defensive system, the characteristics and form of their players or the refereeing style (Chow et al., 2015). (b) Obtaining equally valid performance indicators for all teams can be a difficult task: do all teams have the same ability to pivot, score from the wing or shoot from distance? (Lames & McGarry, 2007). (c) Furthermore, the study of performance indicators must have regard to variability, understood as the ability to solve the same game situation in different ways, which is characteristic of high-level athletes (Corrêa et al., 2020; Correia et al., 2018).
Consequently, it is necessary to search for dynamic performance indicators that take into account the peculiarity of each match and are specific to each team, as sporting success can be achieved by different ways of playing (Laporta et al., 2021). For this reason, the main objective of this study was to identify the positional attack performance indicators of the Spanish women’s handball team during the World Championship in Japan 2019, in which they were runners-up. For this purpose, behaviours were studied specifically in each match and also in general in the championship.
Methodology
Research design
This study was developed according to the observational follow-up/idiographic/multidimensional (F/I/M) design (Anguera et al., 2011): (a) idiographic, because the behaviour of several handball players who, as members of the same team, functioned as a unit, was studied; (b) follow-up, because several matches were analysed, also carrying out intrasession follow-up within each match that provided the frequency and sequence of the behaviours recorded, and (c) multidimensional, because several levels of response, collected in the observation instrument, were studied.
Participants
Seven matches played by the Spanish national handball team during the Women’s Handball World Championship Japan 2019, in which they finished runners-up, were analysed. Two of the five first-phase matches: Montenegro-Spain and Spain-Hungary; all second round matches: Spain-Sweden, Japan-Spain and Spain-Russia; the semi-final, Norway-Spain; and the final, Netherlands-Spain. Thus, seven of the 10 matches played by the Spanish national team in the championship were analysed, excluding three matches from the first phase due to the considerable difference in points scored: Kazakhstan-Spain (16-43), Spain-Senegal (29-20) and Romania-Spain (16-31).
The study was conducted in accordance with the ethical principles set out in the Declaration of Helsinki and, in accordance with the Belmont Report (1978), informed consent and review by the relevant ethics committee was not required because: (a) the study involved the observation of individuals in a public setting (sports venue); (b) the individuals and groups observed had no reasonable expectation of privacy (the matches were broadcast worldwide); and (c) the study did not involve intervention by the researchers or direct interaction with the individuals studied.
Resources
Observation instrument
In order to record the most relevant actions related to the proposed objective, an ad hoc observation instrument was designed (Table 1). A design that combined the field format with comprehensive and mutually exclusive category systems was chosen. This combination exploits the strengths of both instruments; on the one hand, the category system offers theoretical consistency while the field format provides flexibility in recording the specific behaviours to be studied (Anguera & Hernández-Mendo, 2013).

The observation units were the Spanish team’s positional attacks developed in a numerically equal 6 vs. 6 situation, excluding attacks carried out with an empty goal. The positional attack together with the counter-attack constitute the two offensive phases of handball. The positional attack is developed in an organised manner against an organised defence. Therefore, each observation unit began with the start of the positional attack and ended when the Spanish team lost possession of the ball (after a throw-in or defensive recovery) or after a referee signal with no change in possession of the ball, such as a free kick or throw-in (Lozano et al., 2016). A total of 439 attacks were analysed in the seven recorded matches.
The development of the observation instrument was carried out in three phases: 1) Two level IV coaches (highest federation qualification in Spain) with previous experience in observational studies designed an initial version, with the work of Flores and Anguera (2018) and Lozano et al. (2016) proving particularly useful. The purpose was to record the most relevant actions in the different sub-phases of positional attack: initiation, development and completion (Montoya et al., 2013). 2) Subsequently, the instrument was subjected to a precautionary test, which consisted of recording three matches not included in the sample (Anguera, 2003). The precautionary test was designed to in order to add, modify and delete criteria and categories from the initial version of the instrument. The precautionary test was passed when no new patterns of behaviour were detected in any of the criteria. 3) The instrument was judged by five experts, university handball teachers and level IV coaches. The experts filled in a rating form in which they had to mark their approval or disapproval of each criterion and category. Ultimately, all the criteria and categories that comprised the observation instrument obtained an approval rating of 80% or more, i.e. at least four of the five experts gave their approval: 100% for the criteria NUM, DEF, ATT, SEQ, LAF, SAP, PAF, LIF, JIF and 80% for the criteria TSA, XSA, AFI, DIF. The final version of the observation instrument consisted of 13 criteria and 58 categories.
Recording instruments
For the recording and classification of behaviours, the observation instrument was inputted into Dartfish 5.5 software, which thereby acted as a recording instrument. Polar coordinate analysis was carried out with HOISAN 1.2 software (Hernández-Mendo et al., 2012). Prior to the calculation of polar coordinates and as a prerequisite, sequential delay analysis was conducted using GSEQ 5.1 software (Bakeman & Quera, 2011). Finally, after polar coordinate analysis, the significant relationships were plotted using Snowflake 0.2.
Procedure
The recording and classification of behaviours was carried out by two observers. Both were involved in the development of the observation instrument and had experience in observational studies, so they were familiar with the recording instrument. To optimise the reliability of the observations, observers participated in a training process in which matches that were not included in the sample were recorded. The training process was concluded when approval levels above .80 were obtained for Cohen’s kappa statistic for all criteria, both at the intra-observer level, a single session recorded by the same observer at two different times (after 16 days), and at the inter-observer level, a single session recorded by the two observers. Once the training phase was over, the behaviours observed in each of the seven matches that made up the study sample were recorded and classified. Intra-observer and inter-observer concordance levels were calculated, both with Cohen’s kappa index above .95 for all criteria. According to Landis and Koch (1977, p. 165) the approval level shown in both tests can be considered “almost perfect”.
Polar coordinate analysis
Polar coordinates analysis enables information to be obtained on the behavioural patterns that emerge during the course of the match, and has been used in research in the field of team sports (Castañer et al., 2017). This analysis enables the graphical representation of the relationships, of activation or inhibition, existing between the behaviours studied. In polar coordinate analysis, the behaviours analysed have two roles: focal behaviour, the behaviour that is considered to generate the relationships, and conditioned behaviours, the rest of the behaviours analysed.
As a prerequisite for its calculation, it is necessary to perform the sequential analysis of prospective and retrospective lags (Sackett, 1980). For this purpose, the same number of lags are considered in both scenarios, from 1 to 5 for prospective and from -1 to -5 for retrospective. The prospective perspective provides information on the conditioned behaviours that are activated or inhibited once the focal behaviour is performed. The retrospective perspective provides information on the conditioned behaviours that activated or inhibited the occurrence of the focal behaviour (Anguera et al., 2011).
Once the prospective and retrospective sequential analyses have been carried out, the polar coordinate analysis integrates the two by applying Zsum statistic (Sackett, 1980), a powerful data reduction technique. Each prospective and retrospective Zsum can have a positive or negative character. Thus, the combination of the characters will determine in which of the four possible quadrants (I, II, III, IV) the significant relationships obtained between the focal behaviour and the conditioned ones will be located. Quadrant I indicates a relationship of mutual activation between the focal behaviour and the conditioned behaviour; quadrant IV indicates that the focal behaviour activates the performance of the conditioned behaviour, while it is inhibited by it; quadrant III indicates a relationship of mutual inhibition between both behaviours; and finally, quadrant II indicates that the focal behaviour inhibits the performance of the conditioned behaviour, while the conditioned behaviour activates the occurrence of the focal behaviour (Anguera et al., 2011).
Results
The significant relationships found, those with a radius greater than 1.96 (p < .05), after polar coordinate analysis, are presented below. Each match was analysed independently and the observations from all matches were also analysed together, thus providing insight into patterns of behaviour and performance indicators for each match and in the championship as a whole.
Behaviour patterns
Figure 2 and Table 2 display the patterns of behaviour that emerged during the positional attacks developed in a 6 vs. 6 situation. Category 6v6 acted as the focal behaviour; the other categories of the observation instrument acted as conditioned behaviours. Relationships located in quadrants I and IV are presented, i.e. those behaviours that were activated by the focal behaviour.

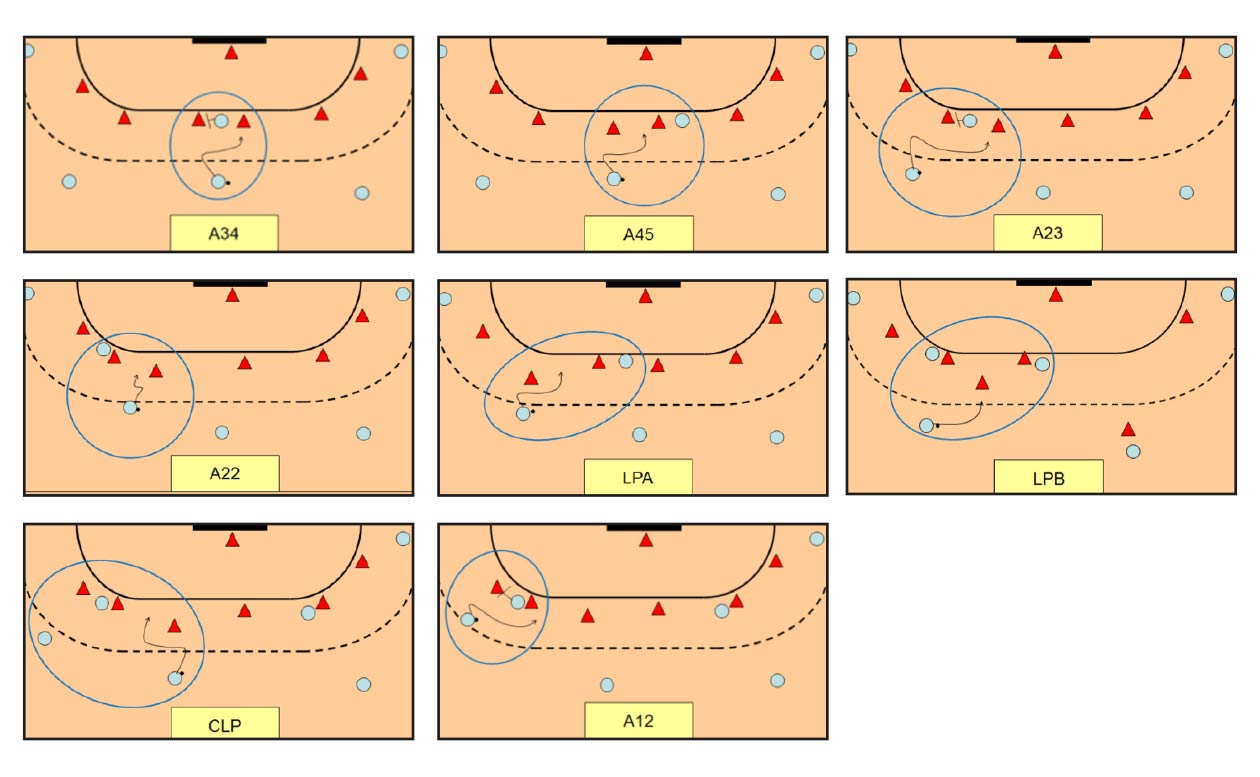
With regard to the type of strong attack carried out, the A34 strong attack (two against two centre-pivots, with the pivot positioned between the centre defenders) was implemented in the matches against Montenegro, Russia and the Netherlands; the A23 type (two against two wing-pivots, with the pivot positioned between the wing and centre defenders) was implemented in the matches against Sweden and the Netherlands; the CLP type (played by the players occupying the centre, wing and pivot positions, after the winger has moved to the pivot position) was implemented only against Japan; the A12 attack type (two against two wing-pivots, with the pivot paired with the outside defender) was implemented against Japan and Russia; the A45 attack type (two against two centre-pivots, with the pivot positioned between the centre and wing defenders) was implemented against Russia and the Netherlands.
In the matches against Montenegro, Japan and Russia, their strong attacks were implemented from the central zone (CNZ). In contrast, in the match against Sweden, strong attacks were launched from the left side of the attack (LZ). In reference to the strong attacking players, the strong attacks made by Alexandrina Cabral (ALE) were implemented in all matches except those against Sweden and Japan, where the strong attacks were made by Alicia Fernandez (ALI).
On the other hand, in relation to completions, those featuring Alexandrina Cabral (ABA) were executed in the matches against Hungary, Russia and the Netherlands, those performed by Alicia Fernández (AFD) were executed in the matches against Russia and the Netherlands, and those performed by Nerea Pena (NPE), in the matches against Hungary and Japan. Regarding the action used in attack completions, 9-metre actions (J9M) were used in the match against Russia, actions from the wing against Sweden, and in the match against Russia the pivot position completions (PIV) and six-metre actions (J6M) were used.
Finally, analysing the records from all matches together revealed the strong attacks: A23, A22, A12, CLP, LPA, A45 and A34; and those made by players Alexandrina Cabral (ALE) and Alicia Fernández (ALI). In terms of completions, the 9-metre shots and those made by Alexandrina Cabral (ABA) were the key ones.
Performance indicators
Figure 3 and Table 3 show the performance indicators, those actions whose prior occurrence was significantly associated with subsequent success (G72), in attacks that pitted six attackers against six defenders (6v6). Therefore, the combination of categories 6v6 and G72 (6v6_G72) served as focal behaviour and the rest of the categories in the observation instrument acted as conditioned behaviours. Relationships located in quadrants I and II are displayed, i.e. those behaviours that were performed earlier and triggered success.
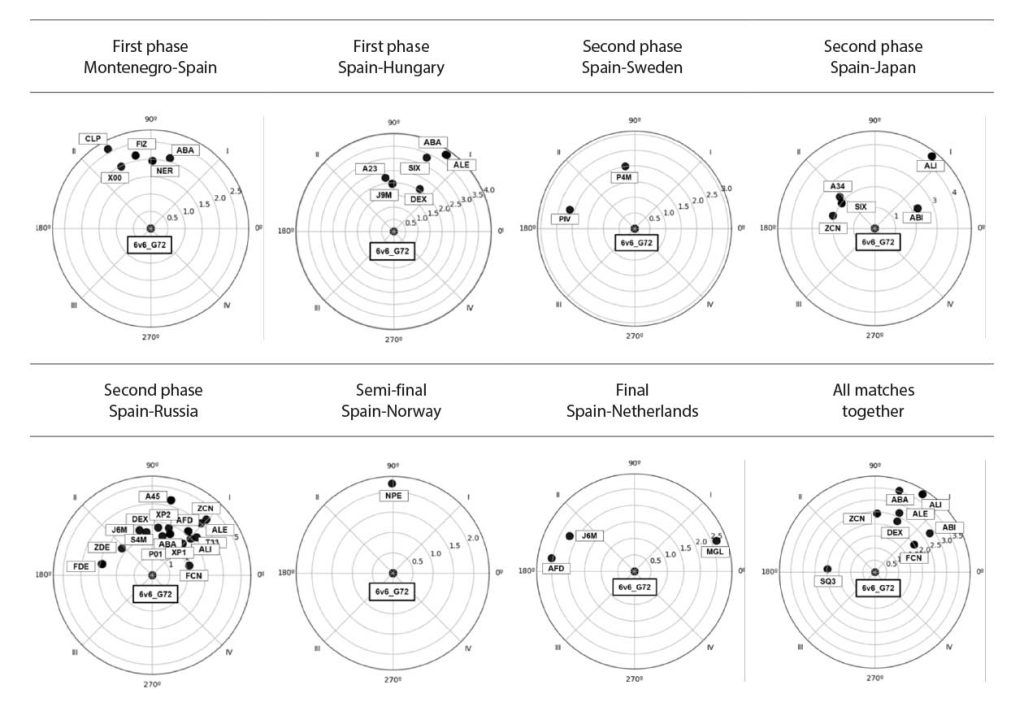
In reference to the type of strong attack that triggered success, in the match against Montenegro it was the CPL situation, in the match against Hungary it was A23, in the match against Japan, A34 and in the match against Russia it was A45. Strong attacks made by Alexandrina Cabral (ALE) were associated with success in the matches against Hungary and Russia; those made by Alicia Fernández (ALI) were associated with success in the match against Japan and Russia, while those made by Nerea Pena (NER) were associated with success in the match against Montenegro.
On the other hand, in terms of completions, those made by Alexandrina Cabral (ABA) were associated with success in the matches against Montenegro and Russia, those made by Alicia Fernández (AFD) against the Netherlands and Russia, and those made by Nerea Pena (NPE) against Norway. Regarding the action used in the completion of attacks, 9-metre actions (J9M) against Hungary, actions from the pivot position (PIV) against Sweden and six-metre actions (J6M) against Russia and the Netherlands acted as performance indicators. In reference to the completion location, for the match against Montenegro from the left (LC) and for the match against Russia from the right (RC).
Finally, when analysing the records from all the matches together, it was observed that the use of the DEX offensive system (one of the players occupying the winger position moving to the second pivot position) triggered the occurrence of success. With regard to the strong attacks, those made from the central zone (CNZ) and those made by the players Alexandrina Cabral (ALE) and Alicia Fernández (ALI) were particularly effective. They also triggered the completion of attacks through actions from the central area (CNZ) and those by Alexandrina Cabral (ABA).
Discussion
The main objective of this study was to identify the positional attack performance indicators of the Spanish women’s handball team during the World Championship in Japan 2019, in which they were runners-up. For this purpose, behaviours were studied specifically in each match and also in general in the championship. The results provided by the polar co-ordinate analysis indicated that the Spanish handball team achieved success through different routes or ways of playing, depending on the demands of each match.
Lozano et al. (2016) noted that the use of different offensive systems helped to overcome opposing defences. In this study it was found that, even within the same offensive system, variability in group and individual behaviour is characteristic of the World Cup runner-up team. This was reflected in the different types of strong attack (those situations involving two or three players that are intended to create an imbalance in the opposing defence) that were implemented: in the games against Montenegro, Russia and Norway the pivot was placed between the central defenders (A34); in the game against Japan the pivot was paired with the outside defender, using situations A12 and CLP; and in the games against Sweden and the Netherlands the pivot was placed between the side and central defenders (A23). Not only in the type of strong attack, depending on the match analysed, did the Spanish team exhibit different patterns of behaviour in other criteria, such as the area in which the strong attack took place, the scoring area or the action carried out to score. As already pointed out by Correia et al. (2018), behavioural variability, understood as the ability to score a goal through different routes, is characteristic of high-level athletes. In view of the results of the Spanish national team, it appears that Spanish coaching staff selected the elements of their game model that they considered most suitable in order to exploit the weaknesses of each opponent.
Continuing to look at the types of strong attack, those that acted as performance indicators (their prior realisation enabled the achievement of subsequent success) also changed according to the match: in the match against Montenegro it was CLP, in the match against Hungary it was A23 and in the matches against Japan and Russia it was the A45 situation. These findings highlight two issues: 1) the importance of playing with the pivot to generate imbalances in the opposing defence is highlighted, something that was previously pointed out by Meletakos et al. (2011) in their analysis of three men’s world championships. However, it should be noted that in this study it was found that the placement of the pivot was different in each of the above-mentioned situations. 2) The types of strong attack used in the analysis of behavioural patterns in a given match do not necessarily coincide with the types of strong attack that acted as performance indicators in that same match. The importance of alternation in offensive behaviour and the influence exerted by previous actions on subsequent success is highlighted, as they condition defensive behaviour. Imagine that an attack ends in a goal after a certain player passes to the pivot. It is likely that, in the next action, when the player who made the pass intervenes again, the defenders will try to block to prevent another pass to the pivot, running the risk of receiving a shot from distance.
However, variability is not present to the same extent in all criteria, as observed in the criterion relating to the player who carried out the strong attack: in four of the seven matches analysed, strong attacks by Alexandrina Cabral (ALE) were made. This result, from the point of view of the theory of complex non-linear dynamical systems, could be understood as an attractor state or general tendency of the system (Balagué & Torrents, 2011). This is possibly due to the fact that the coach wanted to take advantage of this player’s skills to create imbalances in opposing defences. However, when teams have very strong attractor states they become more predictable (Balagué & Torrents, 2011), facilitating the anticipation and strategic approach of the opposing defence.
To date, most research has offered performance indicators obtained from the joint analysis of a large amount of data, pertaining to several matches from the same or different championships. These indicators present a fixed, stable and presumably valid reality for all matches. However, in the present work, analysing the data for all matches together has yielded results that do not allow for an understanding of the specific dynamics of each match. For example, the joint analysis revealed that goals from the central zone were associated with success, consistent with the findings of Srhoj et al. (2001). In contrast, when each match was analysed independently, this result only appeared in two of the seven matches, against Japan and Russia. In other criteria as well, both in the analysis of behavioural patterns and in the analysis of performance indicators, the results for each match differ from those obtained when analysing all matches together. These findings may call into question the usefulness of performance indicators obtained from the analysis of large volumes of data, as in line with previous research (Lames, 2006; Lames & McGarry, 2007; Russomanno et al., 2021), each match offered its own game dynamics.
The analysis of behavioural patterns and performance indicators can be very useful, as they provide specific information on the behaviour of a particular team in certain situations in the competition: what kind of situations they look for to create imbalances in the opposing defence, in which areas, which players are involved in them, etc. This information is very valuable and can be very useful in the day-to-day practice of a particular team, so that the coaching staff can reflect and draw conclusions about the team’s performance. Subsequently, these conclusions can be taken into account in the planning of the training process and in the strategic preparation of the competition.
Although this study provides valuable information on the variability of the behaviour and offensive performance indicators of the World Cup runners-up team, it has some limitations. It does not allow analysis of the intrinsic dynamics of each match and, therefore, of the changes in strategies that take place during the match: within each match there are different games. Nor is the behaviour analysed according to the players who are on the court at that moment, occupying key positions, such as centre-back, which conditions the play of the whole team, as demonstrated by Flores and Anguera (2018). For future research that aims to explore the inherent variability of handball performance indicators, taking these aspects into account could help to capture their dynamic and changeable characteristics.
Conclusions
In relation to the objective of this research and taking into account the results obtained, the following conclusions can be drawn:
- The Spanish national team does not play the same way throughout the tournament, its behaviour varies depending on the match.
- The performance indicators of the Spanish national team are dynamic and variable, changing according to the match analysed.
- The performance indicators obtained from the joint analysis of several matches, while providing general behavioural trends, do not explain the specific dynamics of each match.
- The situations used in order to create imbalances in the opposing defensive system that were associated with achieving success include players occupying the pivot position.
- The scenarios involving the pivot that were associated with success were different in each match.
- Although variability is a characteristic of the Spanish team’s attacking play, some behaviours were very consistent and were repeated in different games, such as the strong attacks by Alexandrina Cabral (ALE).
References
[1] Anguera, M. T. (2003). La observación. In C. Moreno Rosset (Ed.). Evaluación psicológica. Concepto, proceso y aplicación en las áreas del desarrollo y de la inteligencia (pp. 271-308). Madrid: Sanz y Torres.
[2] Anguera, M. T., Blanco-Villaseñor, A., Hernández-Mendo, A., & Losada, J. L. (2011). Diseños observacionales: Ajuste y aplicación en psicología del deporte. Cuadernos de Psicología del Deporte, 11(2), 63-76.
[3] Anguera, M. T., & Hernández-Mendo, A. (2013). La metodología observacional en el ámbito del deporte. E-Balonmano.com: Revista de Ciencias del Deporte, 9(3), 135-160.
[4] Bakeman, R., & Quera, V. (2011). Sequential analysis and observational methods for the behavioral sciences. Cambridge: Cambridge University Press. https://doi.org/10.1017/CBO9781139017343
[5] Balagué, N., & Torrents, C. (2011). Complejidad y Deporte. Barcelona: INDE.
[6] Castañer, M., Barreira, D., Camerino, O., Anguera, M. T., Fernandes, T., & Hileno, R. (2017). Mastery in goal scoring, T-pattern detection, and polar coordinate analysis of motor skills used by Lionel Messi and Cristiano Ronaldo. Frontiers in Psychology, 8, 1-18. https://doi.org/10.3389/fpsyg.2017.00741
[7] Chow, J. Y., Davids, K., Button, C. & Renshaw, I. (2015). Nonlinear Pedagogy in Skill Acquisition: An Introduction. Abingdon: Routledge.
[8] Corrêa, U. C., Bastos, F. H., Silva, S. L., Clavijo, F. A. R., & Torriani-Pasin, C. (2020). Higher variability in dyadic interaction plays a positive role in the decision making of futsal passing. Kinesiology, 52(2), 290-298. https://doi.org/10.26582/k.52.2.17
[9] Correia, V., Carvalho, J., Araújo, D., Pereira, E., & Davids, K. (2018). Principles of nonlinear pedagogy in sport practice. Physical Education and Sport Pedagogy, 24(2), 117-132. https://doi.org/10.1080/17408989.2018.1552673
[10] Flores Rodríguez, J., & Anguera, M. T. (2018). Game Pattern in Handball According to the Player who Occupies the Centre Back Position. Apunts Educación Física y Deportes, 134, 110-123. doi.org/10.5672/apunts.2014-0983.es.(2018/4).134.08
[11] Gruić, I., Vuleta, D., & Milanović, D. (2006). Performance indicators of teams at the 2003 Men’s World Handball Championship in Portugal. Kinesiology, 38(2), 164–175.
[12] Hernández-Mendo, A., López, J. A., Castellano, J., Morales, V., & Pastrana, J. L. (2012). HOISAN 1.2: Programa informático para uso en Metodología Observacional. Cuadernos de Psicología del Deporte. 12(1), 55-78. https://doi.org/10.4321/S1578-84232012000100006
[13] Hughes, M. D., & Bartlett, R. M. (2002). The use of performance indicators in performance analysis. Journal of Sports Sciences, 20(10), 739-754. https://doi.org/10.1080/026404102320675602
[14] Lames, M. (2006). Modelling the interaction in game sports – relative phase and moving correlations. Journal of Sports Science and Medicine, 5, 556–560.
[15] Lames, M., & McGarry, T. (2007). On the search for reliable performance indicators in game sports. International Journal of Performance Analysis in Sport, 7(1), 62–79. https://doi.org/10.1080/24748668.2007.11868388
[16] Landis, J. R., & Koch, G. G. (1977). The measurement of observer agreement for categorical data. Biometrics, 33, 159–174. https://doi.org/10.2307/2529310
[17] Laporta, L., Aripo Medeiros, I. A., Vargas, N., de Oliveira Castro, H., Bessa, C., João, P. V., Teixeira Costa, G. D. C., & Afonso, J. (2021). Coexistence of distinct performance models in high-level women’s volleyball. Journal of Human Kinetics, 78, 161-173. https://doi.org/10.2478/hukin-2021-0048
[18] Lozano, D., Camerino, O., & Hileno, R. (2016). Dynamic Offensive Interaction in High Performance Handball. Apunts Educación Física y Deportes, 125, 90-110. https://doi.org/10.5672/apunts.2014-0983.es.(2016/3).125.08
[19] Meletakos, P., & Bayios, I. (2010). General trends in European men’s handball: a longitudinal study. International Journal of Performance Analysis in Sport, 10, 221-228. https://doi.org/10.1080/24748668.2010.11868517
[20] Meletakos, P., Vagenas, G., & Bayios, I. (2011). A multivariate assessment of offensive performance indicators in Men’s Handball: Trends and differences in the World Championships. International Journal of Performance Analysis in Sport, 11, 284-294. https://doi.org/10.1080/24748668.2011.11868548
[21] Montoya, M., Moras, G., & Anguera, M. T. (2013). Análisis de las finalizaciones de los extremos en balonmano. Apunts Educación Física y Deportes, 113(3), 52-59. https://doi.org/10.5672/apunts.2014-0983.es.(2013/3).113.05
[22] Ohnjec, K., Vuleta, D., Milanović, D., & Gruić, I. (2008). Performance indicators of teams at the 2003 World Handball Championship for women in Croatia. Kinesiology, 40(1), 69–79.
[23] Prieto, J. (2015). Complex and dynamical systems analysis in Spanish Professional Handball League. [Doctoral dissertation, Polytechnic University of Madrid]. https://doi.org/10.20868/UPM.thesis.37217
[24] Prieto, J., Gómez, M. Á., & Sampaio, J. (2015). From a static to a dynamic perspective in handball match analysis: A systematic review. The Open Sports Sciences Journal, 8(1), 25-34. https://doi.org/10.2174/1875399X01508010025
[25] Rogulj, N., Srhoj, V., & Srhoj, L. (2004). The contribution of collective attack tactics in differentiating handball score efficiency. Collegium Antropologicum, 28(2) 739–746.
[26] Russomanno, T. G., Lam, H., Knopp, M., Huang, H., Stadtlander, T., & Lames, M. (2021). Within Match Performance Dynamics Momentary Strength in Handball. Journal of Human Kinetics, 79(1), 211-219. https://doi.org/10.2478/hukin-2021-0073
[27] Sackett, G. P. (1980). Lag Sequential Analysis as a data reduction technique in social interaction research. In D. B. Sawin, R. C. Hawkins, L. O. Walker, & J. H. Penticuff (Eds.). Exceptional infant. Psychosocial risks in infant- environment transactions (pp. 300-340). New York: Mazel.
[28] Sampaio, J., Ibáñez, S., & Lorenzo, A. (2013). Basketball. In T. McGarry, P. O’Donoghue, & J. Sampaio (Eds.). Routledge handbook of sport performance analysis (pp. 357-366). London: Routledge.
[29] Srhoj, V., Rogulj, N., Padovan, M., & Katić, R. (2001). Influence of the attack end conduction on match result in handball. Collegium Antropologicum, 25(2), 611–617.
[30] The Belmont Report (1978). Ethical Principles and Guidelines for the Protection of Human Subjects of Research. The National Commission for the Protection of Human Subjects of Biomedical and Behavioral Research. U.S. Department of Health, Education, and Welfare, DHEW Publication No. (OS) 78-0014
[31] Volossovitch, A., Dumangane, M., & Rosati, N. (2010). The influence of the pace of match on the dynamic of handball game. International Journal of Sport Psychology, 41(4), 117.
[32] Vuleta, D., Milanovic, D., & Sertic, H. (2003). Relations among variables of shooting for a goal and outcomes of the 2000 Men’s European Handball Championship matches. Kinesiology, 35(2), 168-183.
ISSN: 2014-0983
Received: July 7, 2022
Accepted: November 23, 2022
Published: April 1, 2023
Editor: © Generalitat de Catalunya Departament de la Presidència Institut Nacional d’Educació Física de Catalunya (INEFC)
© Copyright Generalitat de Catalunya (INEFC). This article is available from url https://www.revista-apunts.com/. This work is licensed under a Creative Commons Attribution-NonCommercial-NoDerivatives 4.0 International License. The images or other third party material in this article are included in the article’s Creative Commons license, unless indicated otherwise in the credit line; if the material is not included under the Creative Commons license, users will need to obtain permission from the license holder to reproduce the material. To view a copy of this license, visit https://creativecommons.org/licenses/by-nc-nd/4.0/deed.en


