Observational analysis of an extreme skateboarding modality: downhill skateboarding
Saül Aixa-Requena
Oleguer Camerino

Xavier Iglesias
*Corresponding author: Saül Aixa-Requena sar.lete35@gmail.com
Cite this article
Aixa-Requena, S., Camerino, O. & Iglesias, X. (2025). Observational analysis of an extreme skateboarding modality: downhill skateboarding. Apunts Educación Física y Deportes, 160, 35-48. https://doi.org/10.5672/apunts.2014-0983.es.(2025/2).160.05
Abstract
Competitive downhill skateboarding is an extreme form of skateboarding that consists of going down a steeply sloping, winding road closed to traffic at maximum speed on a skateboard. The behaviours of riders in a downhill skateboarding race, where they can reach speeds of over 100 km/h, have never been studied. The objective of the work was to build an observation instrument that would allow us to record their behaviours in competition and to perform a statistical analysis of ANOVA variance and chi-square to detect the variability of this behaviour according to the positioning of the riders during the race, together with the analysis of T-Patterns. The free software LINCE PLUS and Theme 6 EDU were implemented to record 23 participants in finals, semifinals and consolation finals of the Kozakov circuit (Czech Republic) between 2015-2022 in the Open category. Although no significant differences were detected in the actions based on the competitors’ race positioning (p >.05) or in the T-Patterns, there is a significant relationship with the type of curve line (p >.05). In other words, the competitors followed the same line through the curve regardless of their race positioning; however, each curve was approached differently depending on its specific characteristics. The observation tool (OSKATE) can be useful in preparing for competitions in this high-speed sport, and others such as skiing and motor sports, to adapt to the conditions of different competition circuits.
Introduction
Downhill skateboarding, an extreme form of skateboarding, represents an exciting and risky sporting challenge that tests different abilities such as strength, balance and coordination as in snowboard-cross (Platzer et al., 2009; Vernillo et al., 2018), along with the ability to manage stress, maintain concentration and make quick decisions in changing conditions, as in other risky sports (Reid & Lightfoot, 2019).
Skateboarding had its origins around the 1950s in California, when creative surfers used pieces of broken surfboards, to which they added axles and skate wheels that allowed them to surf the streets when waves were scarce (Amtmann et al., 2013). Over the years, significant changes were made to the material, including changes in board shape, axle geometry, and wheel sizes, which resulted in different modes depending on the configuration of the skateboard parts (Prentiss et al., 2011), until what is now downhill skateboarding.
Downhill skateboarding is an extreme form of skateboarding, which consists of going down a road in the shortest possible time with boards made of wood, fiberglass and carbon fibre about 76 cm long and 23 cm wide, 78 mm wheels and 100-120 mm axles. Competitions, according to the organising entity, may have equipment limits: boards up to 122 cm long, axles less than 305 mm, wheels between 65-110 mm and a maximum weight of 6 kg. Competitions have timed qualifying rounds and then 4-on-4 opposition races up to the finals. Also known as downhill longboarding, the term downhill skateboarding (DHSk8) has recently become popular. After the dissolution of the International Downhill Federation (IDF) in 2023 (founded in 2012), the World Downhill Skateboarding Championship (WDSC) and the World Skate Games (WSG) are currently the international competitions.
Although there is some work on skateboarding, we found that there are few scientific studies on downhill skateboarding. We can find descriptive studies on the most common injuries (Russell et al., 2019); training and physical preparation proposals to improve the competitor’s posture (tuck) (Pereira da Silva et al., 2017); research on bioenergetics, propelling oneself at different speeds (Amtmann et al., 2013; Board & Browning, 2014); and work on aerodynamics with different helmets (Hart et al., 2010).
The requirements of this sport specialty are focused on perceptual-motor decision mechanisms (balance, proprioception…) (Castañer & Camerino, 2022), and also contextual (characteristics of the environment in which it is practiced: asphalt, temperature, curve, opponents…). Downhill skateboarding requires skills such as air braking, turning, sliding, and taking lines. In addition, the ability to perform a complete and quick stop is crucial (Kamberg, 2017). The control of these technical skills is very relevant, both to win and to simply survive and continue practicing this risky sport.
In this sport, as well as in other high-speed sports such as alpine skiing or motor sports, visuomotor conditions play an important role, as they are a tool for anticipation of the trajectory to be followed (Tuhkanen et al., 2021), and thus cause control of body direction. But in competition, when faced with an unforeseen event due to the opponents’ fault, this glance and anticipation of the trajectory can no longer be easily developed. Therefore, it seems logical that during a race, riders have different behaviours depending on their visibility, the position of the rivals and their own position during the race.
Experts in high-speed sports use specific cognitive strategies and predictive brain processes to improve their performance (Lappi, 2022). Lappi (2022) explores cognitive hierarchy in high-speed sports, such as motor racing. He highlights three levels: navigation (route selection), guidance (definition of the desired route) and control (sensorimotor coordination). The main idea is that these levels process information differently, with a novelty in the interpretation of central concepts, such as landmarks and waypoints, integrated by means of chunking. Chunks can be understood as meaningful patterns stored in working memory and transferred to long-term memory. With experience, these chunks enable rapid identification of complex situations with many elements, which increases the ability to encode information despite the limitations of working memory and attention. This model can also be applied in downhill skateboarding, where prior visuomotor preparation and decision making can play a key role in the performance of the practitioners. Although chunks can help to act in complex situations, the field of view and proximity to opponents can affect this decision making.
In addition, practicing this sport involves psychological stress, an effect that varies during the race, as in other risk and opposition sports (Reid & Lightfoot, 2019). This mental stress is pervasive among athletes, along with a perception of risk and risk taking that directly influences decision making (Powell, 2007). This stress, which affects the physiology and functioning of the body, can make movements less fluid and inefficient (Reid & Lightfoot, 2019), which can lead to technical and decision errors. However, the response to certain unfavorable situations is highly individual and experience may be one of the reasons for decreased performance (Barthel et al., 2020).
In summary, downhill skateboarding is a sport in which competitors’ motor patterns, visuomotor conditions, anticipatory mechanisms, decision making and emotional control can play a crucial role, since, as in motorsports (Lappi, 2022), a small mistake can make you win or lose the race.
Since the competition analysed is of high level and it is assumed that all athletes have a highly developed technique, this work focuses on analysing whether the positioning of the competitors during a downhill skateboarding race affects their actions, as well as investigating the existence of a recurrent motor pattern in this competitive modality.
Thus, the main objective was to create an instrument, using observational methodology, to identify riders’ behaviours based on their race positioning and throughout the entire descent. This would allow for recording and analysing the relationship between different behaviours, including braking zone, braking type, line, stability, tuck, and interactions with rivals. The behaviours of the riders participating in the study were recorded a posteriori using this instrument for descriptive and inferential statistical analysis with analysis of ANOVA variance and chi-square, to be complemented with a T-Patterns analysis. This can provide a deeper understanding of the dynamics of competition in the sport, offering riders guidance to improve their competition strategy and preparation.
Methodology
Observational design
A P/I/M (punctual, idiographic and multidimensional) observational and intra-session design was used for the study, as there was no temporal follow-up of participants across seasons (Anguera et al., 2011). Punctual because it analysed only the semifinals and finals of the Open category of the competition at the Kozakov circuit (Czech Republic); idiographic because all participants were analysed as a unit; and multidimensional because different dimensions were analysed in relation to running position, body orientation and other biomechanical and behavioural aspects.
Participants
A total of 23 riders between 18 and 32 years of age were analysed, of which 22 were male and 1 female. They were analysed through 20 video recordings of about 3 minutes from different competitions (finals, semi-finals and consolation finals) on the Kozakov circuit between 2015 and 2022. The category was Open, the highest one, open to everyone. The recordings chosen were public (IDF’s YouTube or Facebook). Therefore, following the ethical principles guidelines described by the American Psychological Association, as they were published on the internet and recorded in a natural setting, informed consent did not have to be requested from participants (American Psychological Association, 2017). It was recorded during the months of February and March 2024.
The inclusion criteria for the videos analysed were as follows: at least one participant was followed during the entire descent, from the start of the race until they crossed the finish line; the image quality was sufficiently good; and at least two competitors participated in the recording. The exclusion criterion for the choice of recordings and competitors was the unobservability of the analysed rider’s actions during the entire descent. If the competitor appeared in more than one video and met the inclusion criteria, the most recent one was selected.
Materials and instruments
The recording instrument was LINCE PLUS (Soto et al., 2019, 2022) in version 1.3.2. for Mac Os Catalina 10.15.7.
Table 1 shows the observation instrument with examples of some of the criteria and categories. For the T-Patterns analysis, the criteria of stance, tuck time and body orientation on the curve were eliminated because they did not provide meaningful or consistent sequential information, as they are static or vary independently of the key behavioural sequences analysed in this study.

Table 1
Observational instrument for the observational analysis of downhill skateboarding (OSKATE).
The study of T-Patterns in sport is conceived as a method of observational data analysis that, by means of a mathematical algorithm, makes sequentially and temporally ordered behaviours visible (Bakeman & Quera, 2011; Camerino et al., 2014). T-Patterns can also be defined as events that occur concurrently or sequentially more frequently than would be randomly expected if all events were independently distributed (Anguera et al., 2023). It is a way to discover, systematise and analyse regular structures of behaviour (Magnusson, 2020). The study of T-Patterns has been very useful in different sports and educational contexts (Castañer et al., 2020; Prieto et al., 2016).
Procedure
The design of the observational instrument and its validation process were carried out in three successive stages: first, a review of the literature and selection of the main criteria and categories to be included in the instrument, followed by the elaboration of a proposal for an observation instrument with experts in observational methodology and in the sports specialty studied. Finally, we moved on to a content validity check of the observational instrument created through a panel of experts, to ensure that we measured what we intended to.
This third validation phase was carried out using the (Anguera & Blanco, 2003) authority criterion expressed by the judgment of a panel of 13 experts. These people had more than 4 years of experience in international competitions, some with world podiums and, among others, qualifications such as Skateboarding Level 1 Technician or graduates in Physical Activity and Sports Sciences. Through a survey developed with Google Forms, experts evaluated each of the 10 criteria of the observation instrument, assigning a validation response (YES or NO) to each of the 46 categories of the instrument. The main objective of this phase was to validate the instrument using a methodology based on the percentage of positive coincidences, considering YES-YES responses as an indicator of positive consensus on the validity of the criteria.
To analyse the data, the percentage of positive coincidences (n = 3289), corresponding to affirmative coincident responses among the experts, was calculated out of the total possible coincidences (n = 3588). This percentage was obtained by contrasting the responses of each expert (n = 46) with those of the other experts (n = 12) individually. Thus, a proportion of positive coincidences of 91.7% was obtained, which reflects a high level of agreement among the experts in the validation of the proposed criteria.
To ensure the accuracy of the results, a 95% confidence interval was calculated using the binomial model applied with the binom.test() function of RStudio (© 2009-2021 RStudio, PBC v.1.4.1717). The results provided a confidence interval ranging from 90.7% to 92.6%, which reaffirmed the robustness of the observed coincidence rate and, therefore, the validity of the observation instrument. After validation of the instrument and a period of training in its use, an expert in the sport and one of the authors of the study made a total of 63 records in the analysis of two different descents. Inter-observer reliability was calculated by comparing the expert’s records with those of the author through LINCE PLUS and a kappa statistical index of .983 was obtained. As for intra-observer reliability, the author repeated the recording on two occasions, with a 10-day interval, and obtained a kappa index of .988. Once the reliability process was completed, data from all subjects were recorded through LINCE PLUS. Subsequently, the results were exported in .csv and .txt for further analysis.
Data analysis
The descriptive data, referring to the count of the qualitative variables of the study (the criteria and categories of the observation instrument [OSKATE]), are presented with frequencies and percentages (Table 2). For the quantitative variables of the study (tuck time, tuck duration, number of braking actions and records), the normality of the data distribution is checked and the trend, variation and the minimum and maximum values are presented (Table 3). For those with symmetrical distribution, the mean and standard deviation are presented; for those with asymmetrical distribution, the median and its interquartile range are presented.
Table 3
Descriptive and inferential data of global quantitative variables and according to final position.
To analyse the relationship between quantitative variables and final positioning, the normality assumption was tested with the Saphiro-Wilk test and its homoscedasticity with the Levene test (Table 3). To test the dependence of the variables, an analysis of ANOVA variance was performed, obtained through the nonparametric Kruskal-Wallis test, and the results were compared according to the final position of the competitor and adding the magnitude of the effect through eta squared (η2), with η2 < . 1 trivial effect; .1 < .η2 < .25 small effect; .25 < η2 < .37 medium effect; and η2 > .37 major effect (Table 3).
To conduct a comparative statistical analysis of behaviour based on race positioning, the relationship between the following qualitative variables was analysed: race positioning, start, tuck time, braking zones and types, curve orientation and lines, posture and stability during the curve, curve number, and interaction with rivals. The assessment of the dependence between the different qualitative variables was performed using contingency tables with the chi-square test with Yates correction (χ²cc), estimating the intensity of association using Cramer’s V (V), with V ≥ .04 small effect, V ≥ .13 moderate effect, and V ≥ .22 large effect (Table 4).
The significance level in all tests was p < .05 and were run with JASP computer software version 0.18.1 (Jasp Team, 2024) and Microsoft Excel version 16.66.1, both programs for MacOs Catalina 10.15.7.
Finally, to perform a T-Patterns analysis, we exported the log in .txt format to Theme6Edu software version 08 (Magnusson, 2017) with the following search criteria: a) presence of at least 3 T-Patterns; b) redundancy reduction setting of 90% for the occurrence of similar T-Patterns, c) significance level of .001, and d) Fausto option enabled to critical interval mode.
Data was published in the Research Data Repository (CORA) at the following URL: https://doi.org/10.34810/data1346 (Aixa-Requena, 2024).
Results
Descriptive and inferential statistics
In the results presented in Table 2, it can be seen how 100% of the riders made a maximum start; 78% of them were regulars (left leg in front). The total shares were fairly evenly distributed among those finishing in 1st, 2nd or 3rd position (~30). The majority of the braking actions were performed when taking the curve (53%) and sliding with gloves on the ground (81%). Most of the curve lines followed an outside-inside-outside pattern (64%) and were stable (73%). Regarding interactions with rivals, it is worth highlighting that 48% were overtakes, 29% were slipstreams, and 20% involved staying behind the opponent.
The descriptive data concerning the overall count of the quantitative variables under study can be found summarised in Table 3 with their trend, variation, minimum and maximum. This table shows that the trend of the total tuck time during a run was 86 seconds, with a duration of 12 seconds each time the mentioned posture was performed. Overall, riders braked a total of about 5 times (5.04 ± 2.46) per run and about 37 records (37.13 ± 6.88) were made per competitor.
The same data distributed according to final position can also be seen in Table 3, with the addition of the confidence interval (95% CI) and the data referring to the analysis of variance. In the aforementioned Table 3, it can be seen that there is no variable that has significant differences in the comparison according to the final position (p-ANOVA > .05), nor in the total number of records (statistic = 2.925; p = .403; η2 = . 087), total tuck time (statistic = 1.809; p = .613; η2 = .108) or total number of braking actions (statistic = 1.481; p = .687; η2 = .078), and all with a trivial (< .1)η2 or small (.1 <η2 < .25) effect size.
Table 4 shows the interdependence between the different qualitative variables. Of note are those where a significant dependence was detected, such as braking zone and braking action (χ2cc(16, N = 116) = 124.380; p < .001; V = .518), curve line and stability in the curve (χ2cc(35, N = 117) = 58.143; p = .008; V = .315), interactions and race position (χ2cc(15, N = 74) = 79.910; p < .001; V = .600), curve number and braking (χ2cc(16, N = 116) = 26.854; p = .043; V = .241), and curve number and braking zone (χ2cc(16, N = 116) = 71.370; p < .001; V = .319). All with a large effect size (V ≥ .22).
T-Pattern analysis
In the observation of the results extracted from Theme6Edu, recurrent and rapid motor patterns during a downhill skateboarding race are evidenced in two types of figures: a) T-Patterns obtained, which Figure 1 illustrates in the form of a dendrogram or tree graph, which indicate the most relevant patterns throughout the different races and participants; and b) representation of one of these patterns detected through a sequence of images of these events and their illustration (Figure 2).
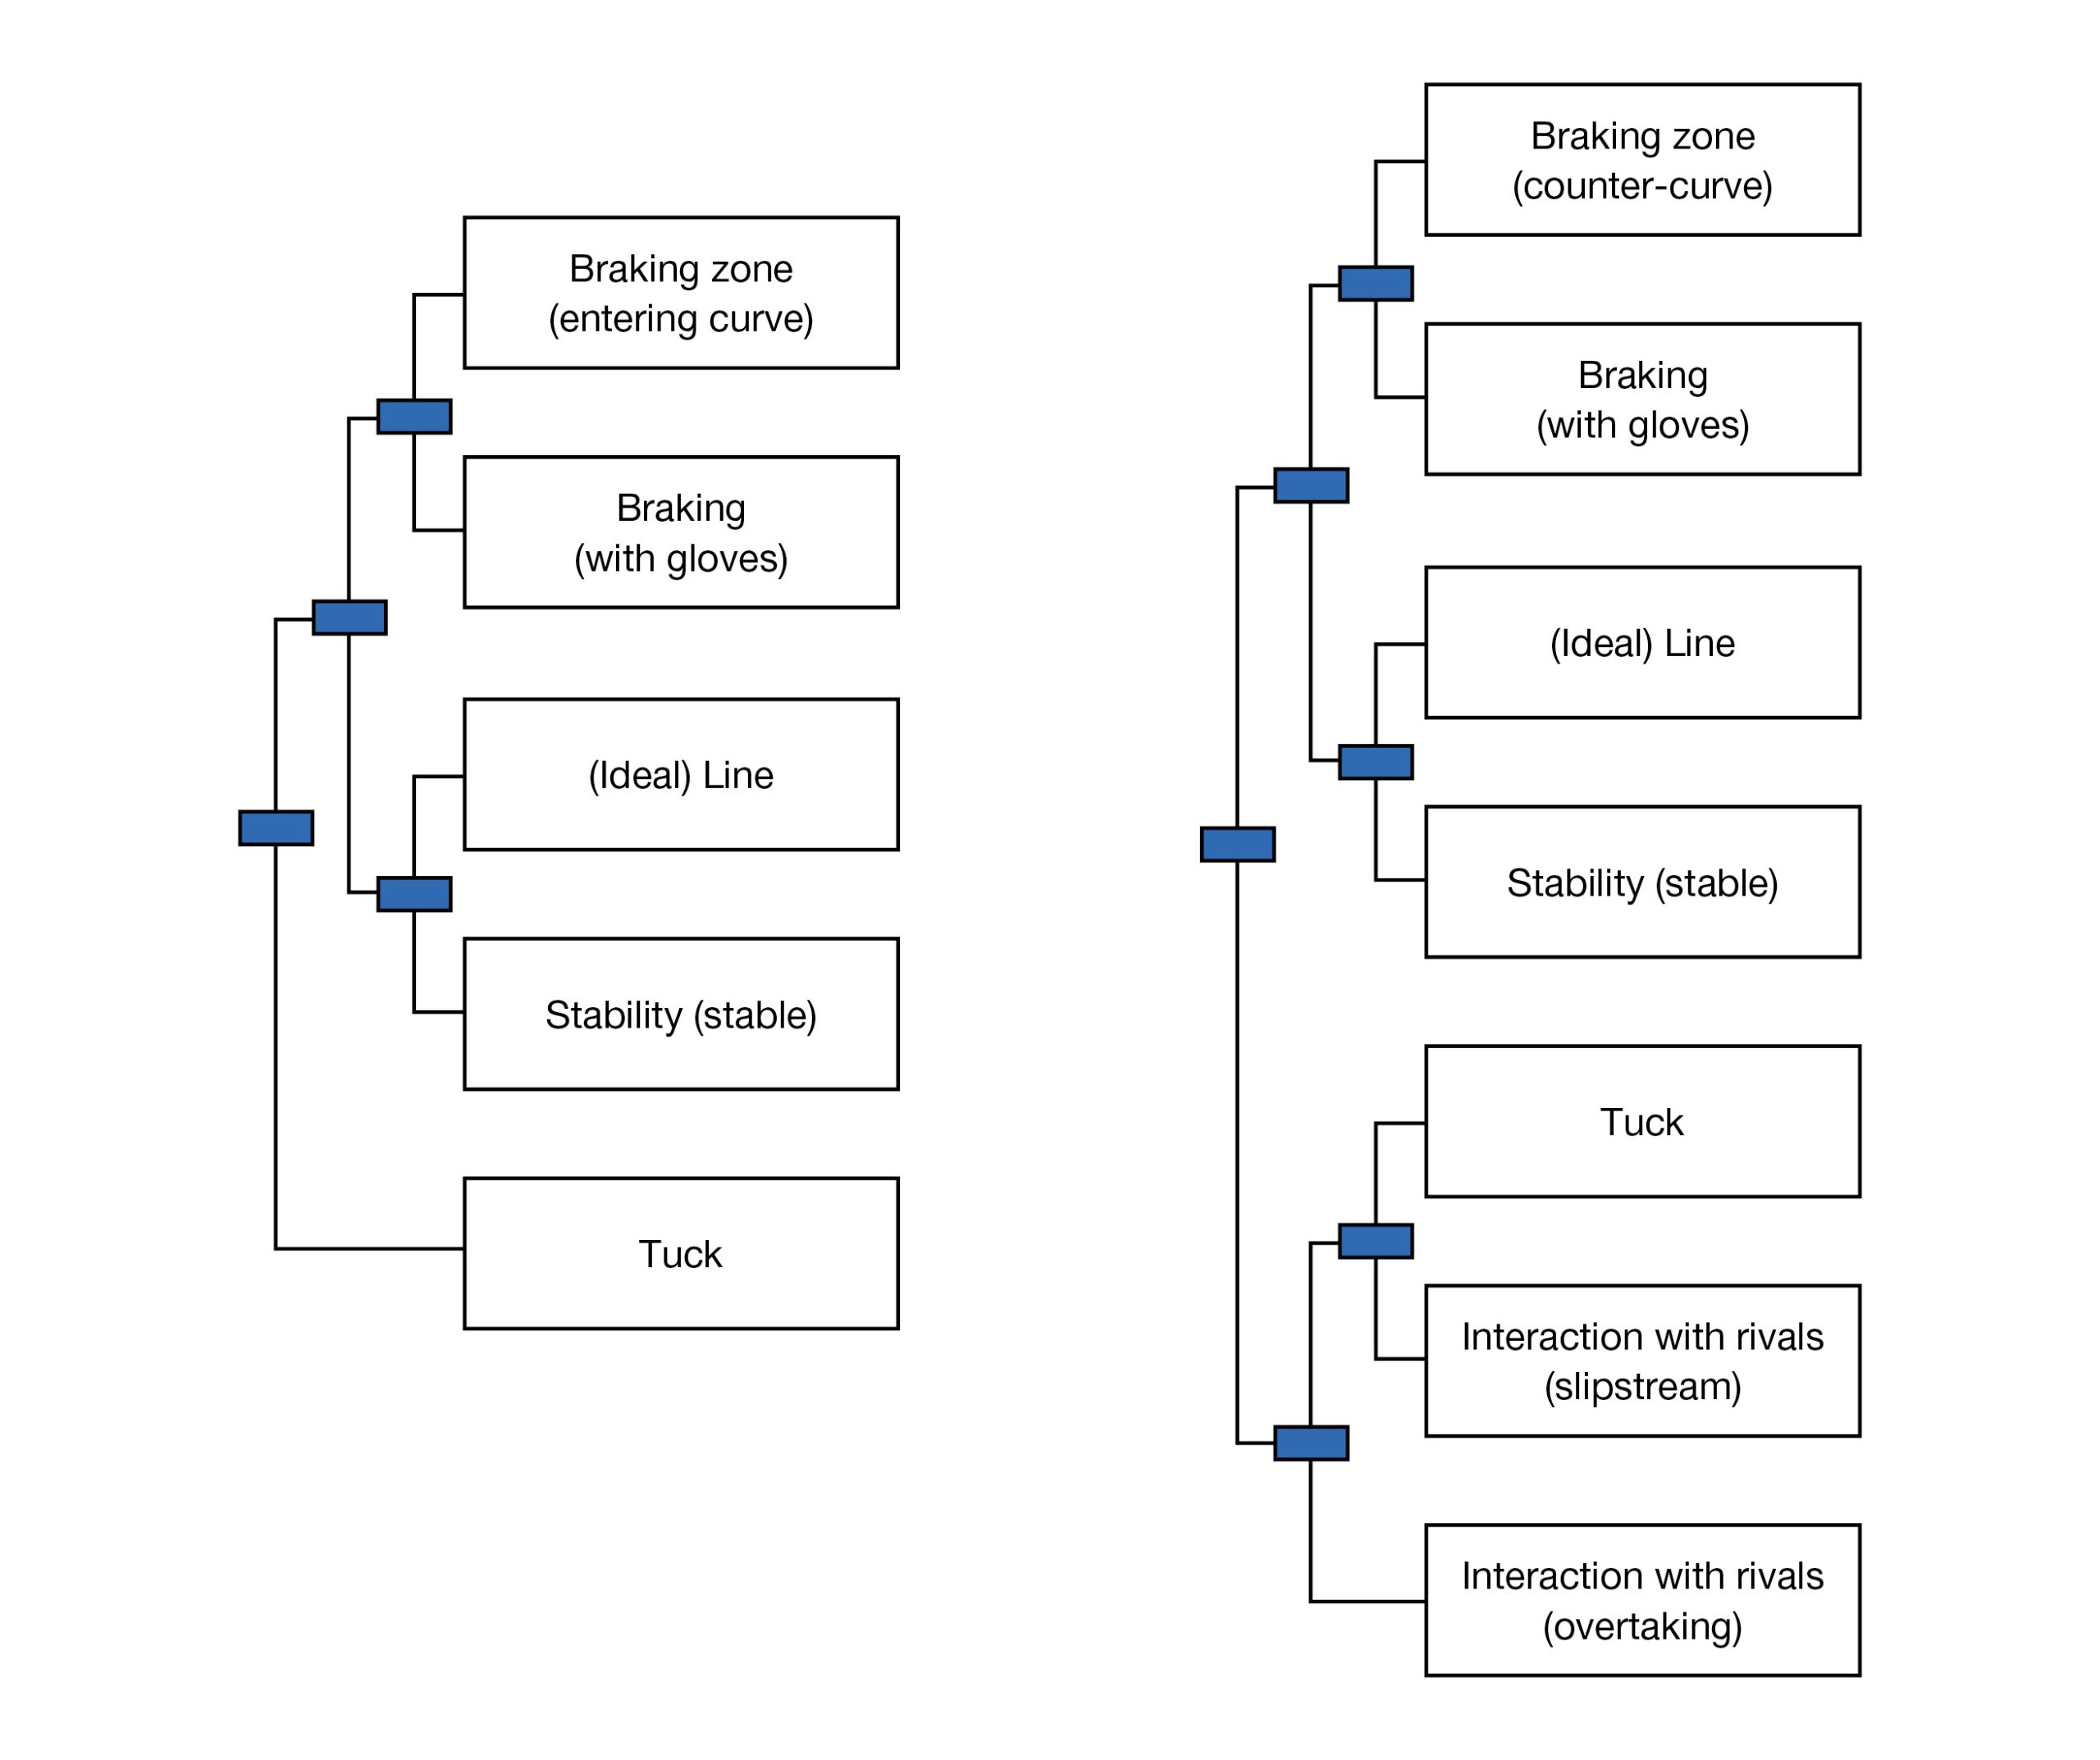
The behavioural dendrogram in Figure 1 shows the two successions of typical patterns that emerged when analysing the participants’ behaviours during the competition. These are patterns that follow a temporal succession over a small-time interval. The succession did not differentiate between the positioning of the participants. The mentioned patterns followed a sequence of braking zone – braking action – line – stability – tuck (+ interaction with rivals), as illustrated in Figure 2.
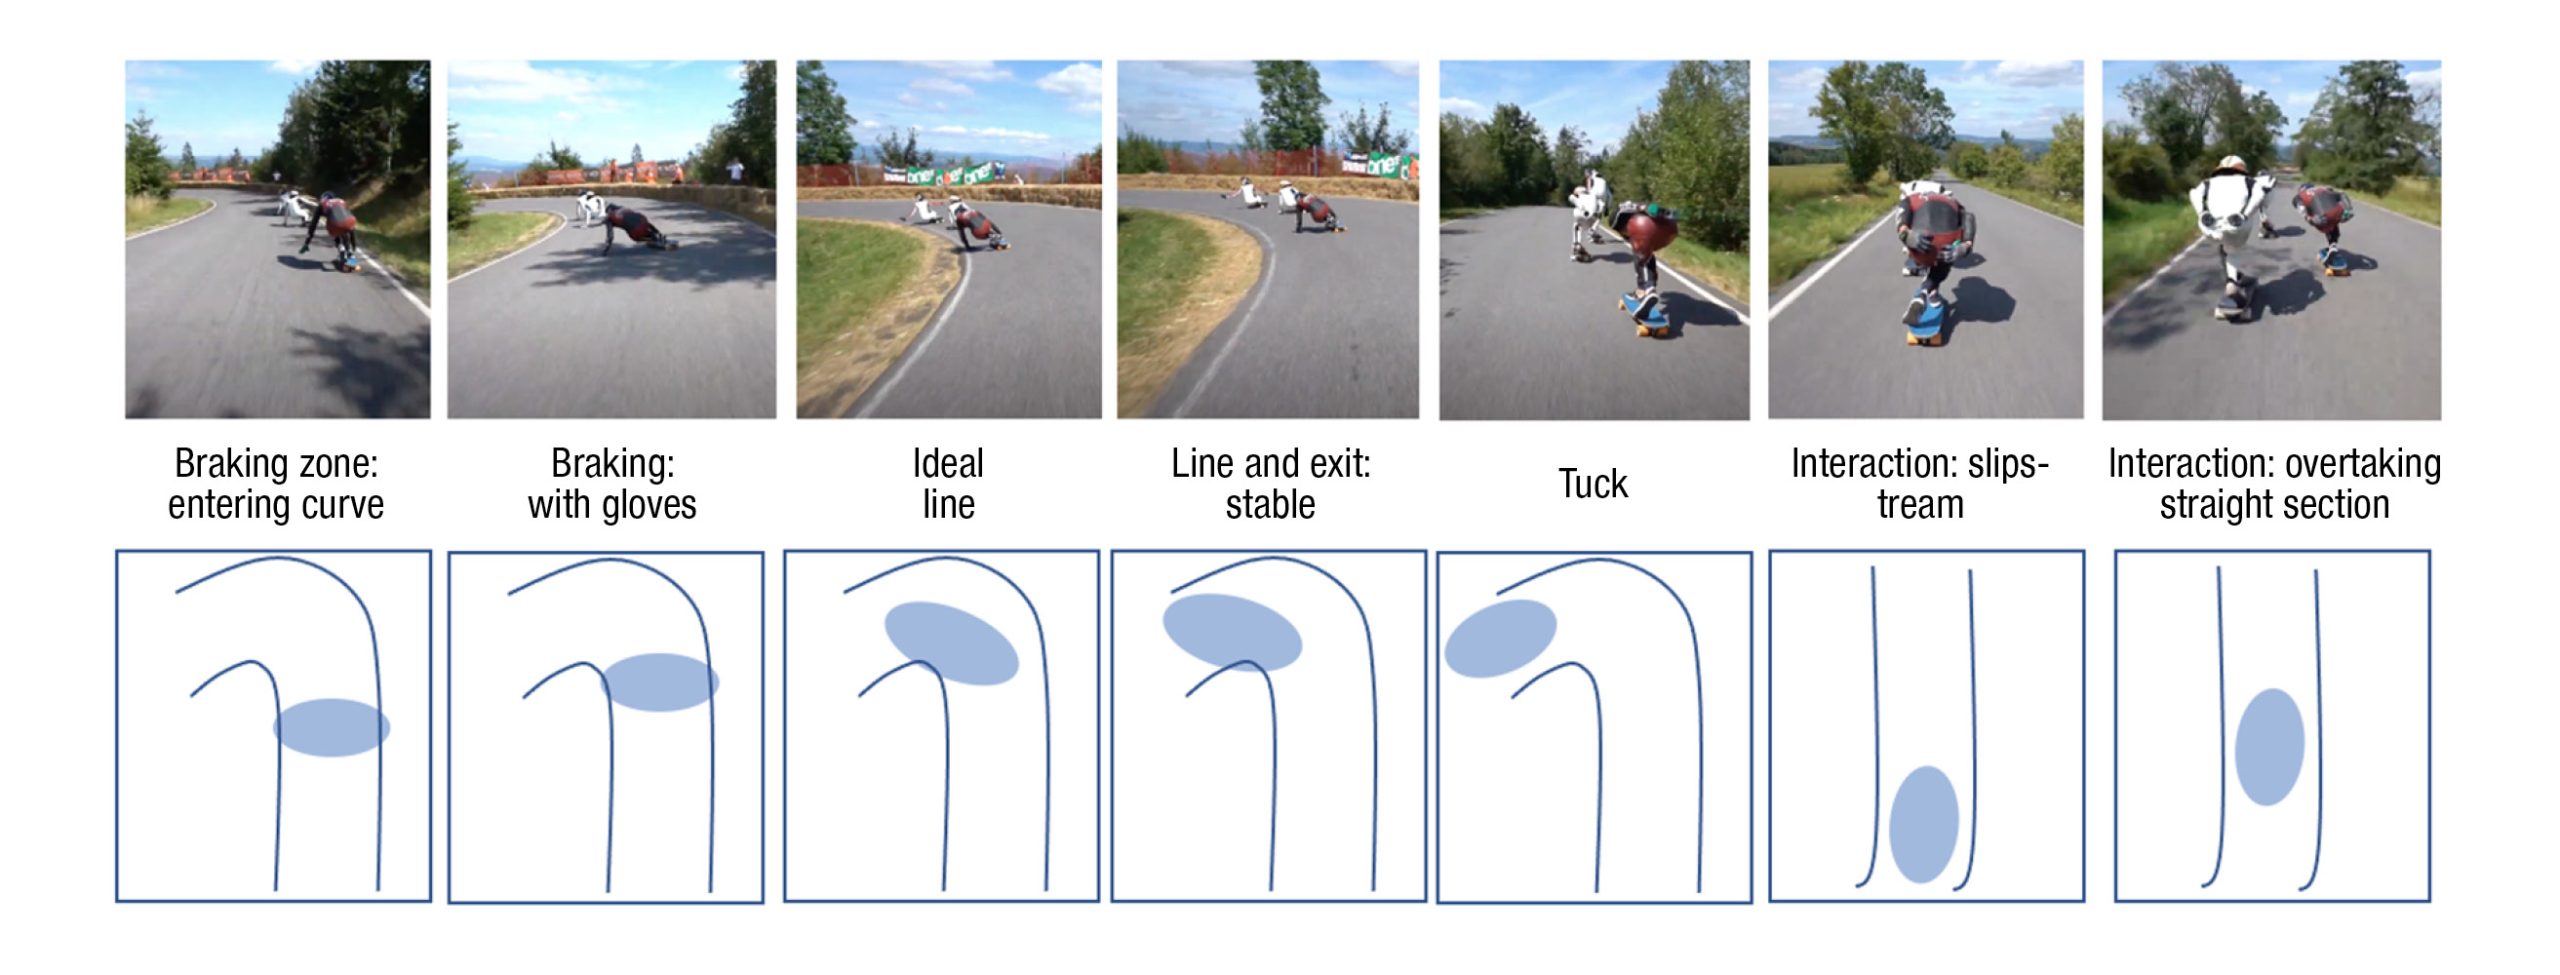
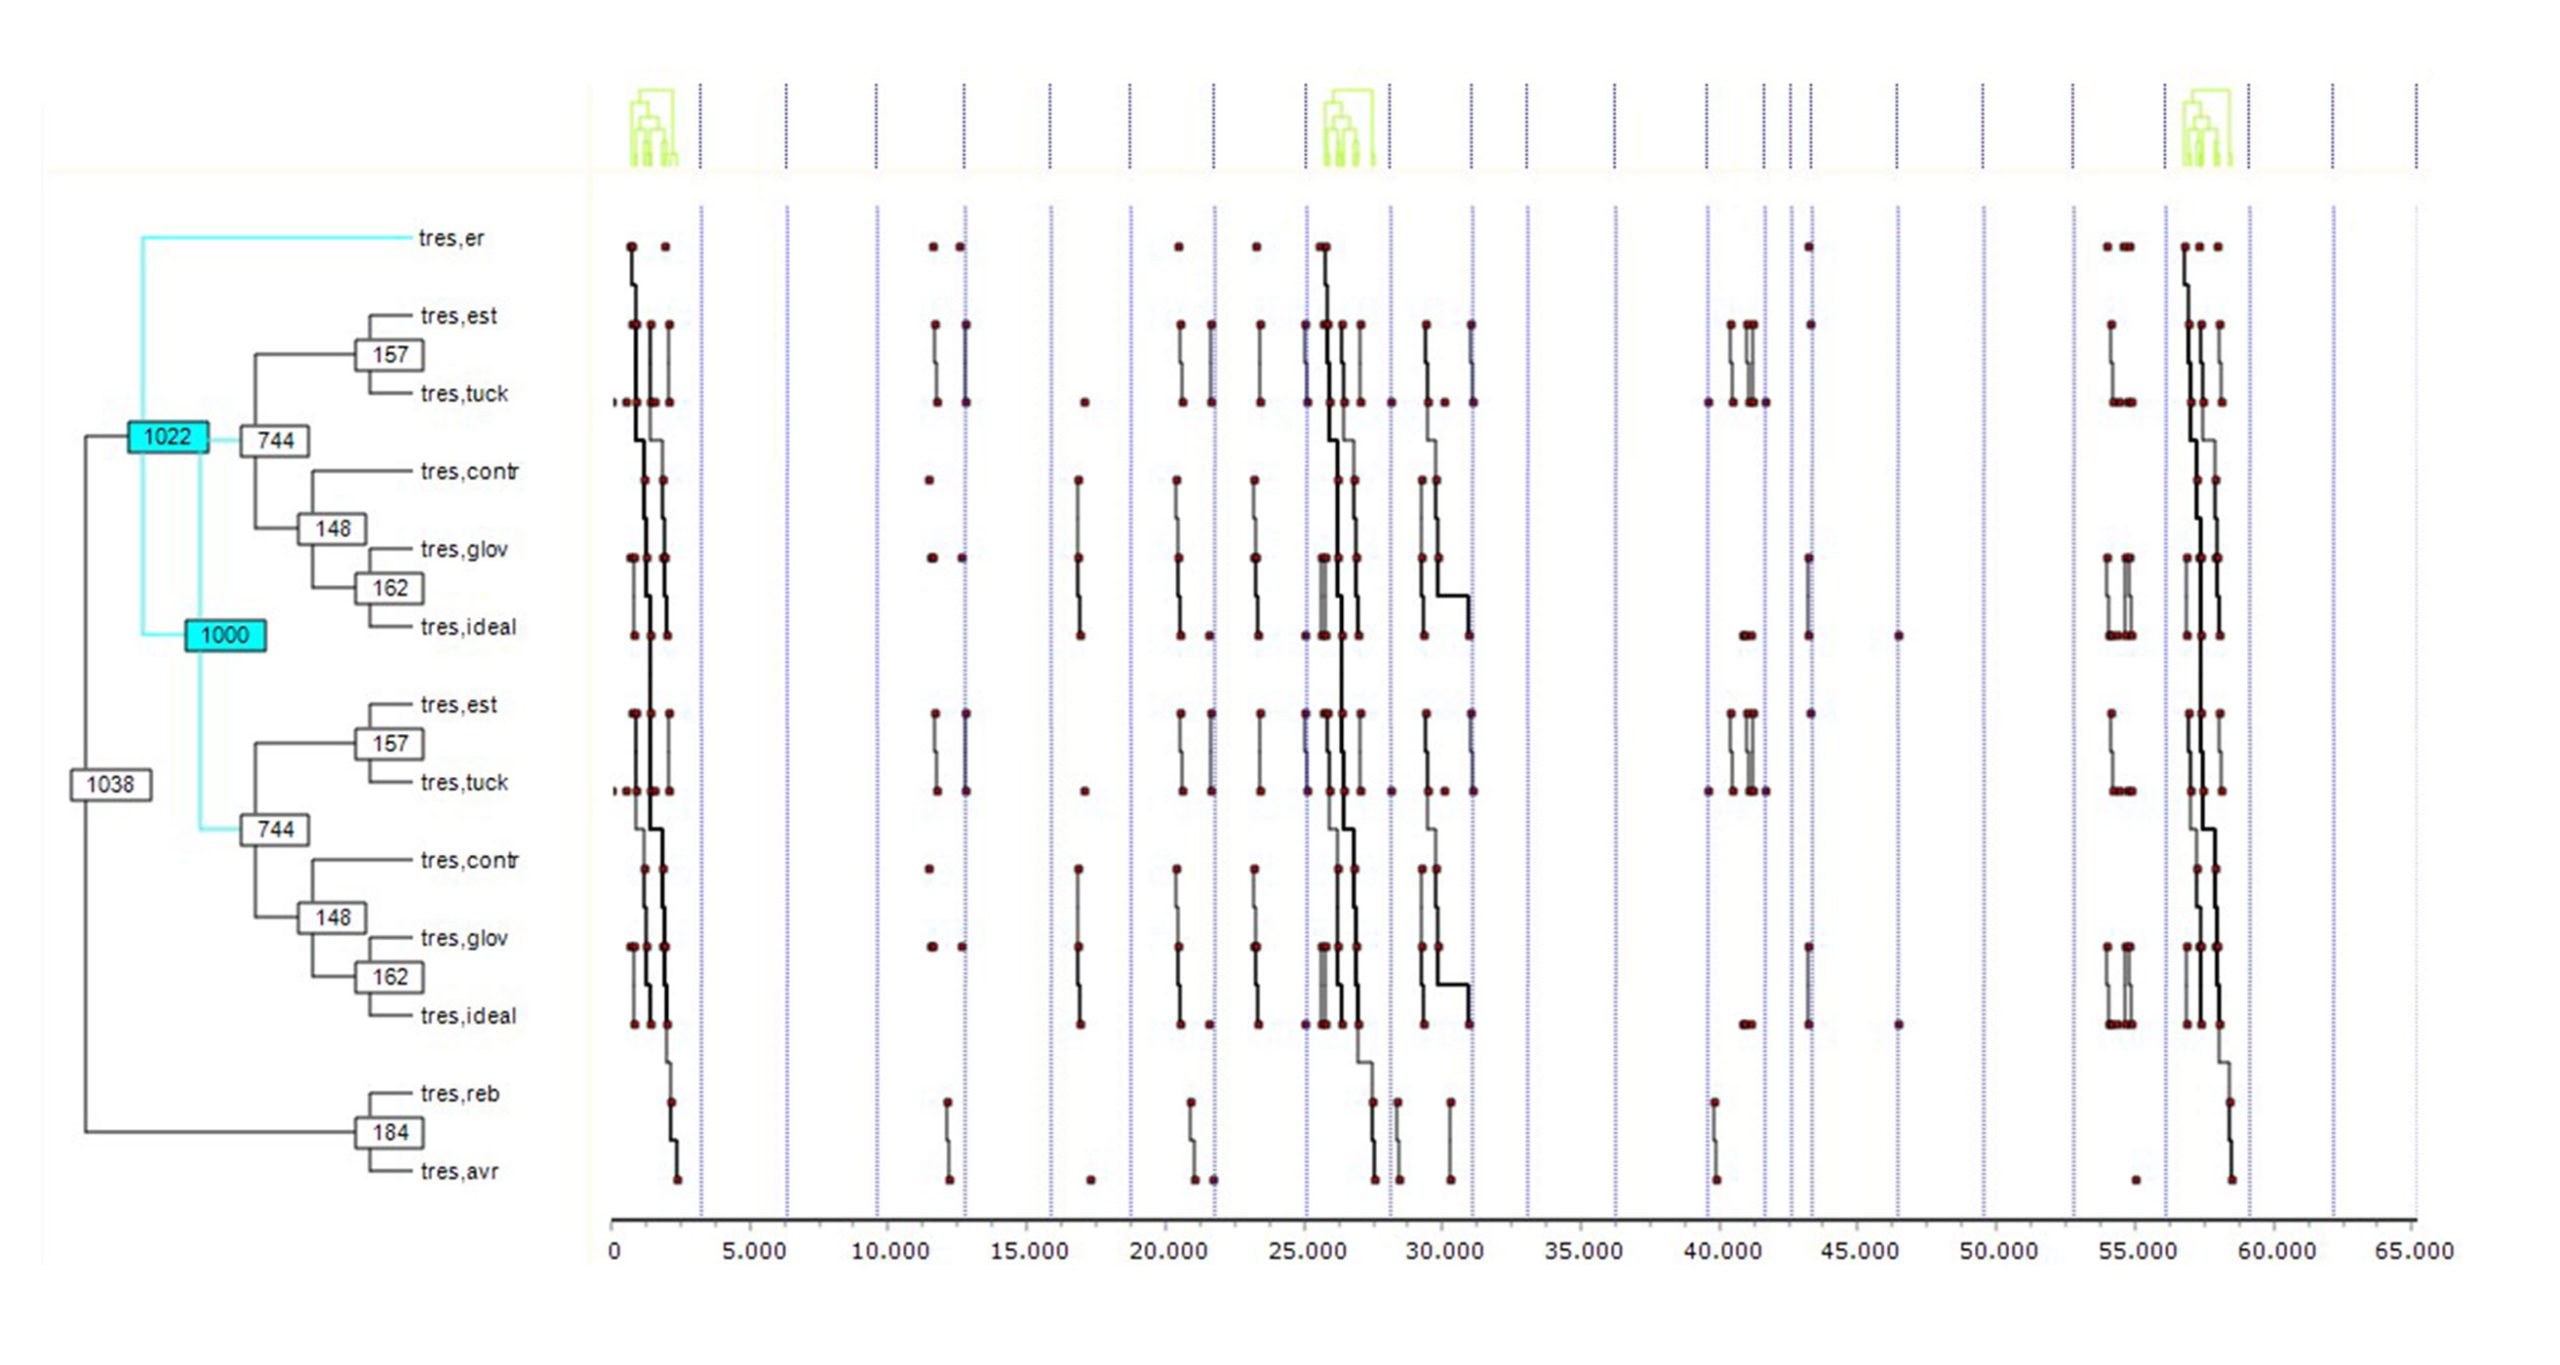
Finally, we present an example of what typically happens in the race: a linked repetition of the previously mentioned pattern (braking zone – braking action – line – stability – tuck), specifically from a rider in 3rd position (Figure 3).
Discussion
The main objective of the present study was to construct an observation instrument to analyse differences in behaviour according to the positioning of the participants during the race. The data obtained show similar results in the behaviour of competitors according to their positioning. In most cases, the participants braked while entering the curve or counter-curve, with their gloves on the ground, and followed a stable outside-inside-outside line. Therefore, no statistically significant differences have been detected in the actions of the competitors according to positioning, except for interactions, which have shown variations in type and quantity according to positioning; the first and fourth position riders are the riders with the fewest interactions. The T-Patterns also do not vary based on race positioning, and the most typical pattern follows a sequence of braking zone – braking action– line – stability – tuck (+ interaction with rivals). However, variables such as zone, braking type, stability, line and curve did have a dependency relationship between them.
These data may clash with those found in motor sports. For example, riders usually have to adjust their line according to the conditions of the race (position, location of rivals in front or behind, road conditions…), which requires high levels of concentration in order to avoid accidents (Ledesma et al., 2015). Sometimes, this optimal line can be affected by a struggle for position and overtaking (Heilmeier et al., 2018) or even by the psychophysiological state of the competitors (Filho et al., 2015). Therefore, the competition environment should theoretically influence participants’ behaviour and their approach strategies for taking curves. However, if there is nothing to prevent them from taking the best line, riders tend to have a very stable curve line pattern, according to their style (Löckel et al., 2022).
This seems to be the case in this research, where, in general, the competitors’ behaviour does not vary based on positioning, as there were not many position battles in which rivals interfered with the tracing of an optimal line. For the same reason, in the present work the T-patterns also do not vary according to positioning during the race. The differences in interactions according to position could be explained by the fact that those in first position tended not to interact with rivals and those in fourth position usually fell behind from the start and did not regain position. Therefore, most interactions were in the second and third positions.
Variables such as the braking zone, braking type, stability, line, and curve were interdependent, likely because a different line strategy was used for each curve, regardless of the competitor and their positioning.
A limitation of the study is the inability to determine whether the recorded behaviours are a response to opponents’ movements. Because of the lack of visibility of the opponents actions, especially those in front, the full understanding of the dynamics of the runners’ actions is restricted. Also, the absence of telemetric data may have limited the full understanding of riders’ behaviour.
Thus, the results of this study suggest that the actions in a downhill skateboarding race can vary significantly depending on the context of the competition. This has important implications for the choice of tracks to compete on and the training of competitors. This information can help competitors and coaches to choose the most appropriate training content according to the nature of the competition. For example, if a circuit has few interactions and riders’ behaviour does not vary based on positioning, pre-competition training content can be more technical and focused on the ideal curve line. In this case, this will benefit competitors who are not as good at competing in shared spaces, but who excel in the qualifying rounds. Therefore, it can also help in the choice of competitions in which to participate.
Future research could explore other factors such as behavioural analysis based on the actions of rivals, along with telemetric data to get an ‘x-ray’ of what happens in a downhill skateboarding race.
Conclusions
On the Kozakov track, no statistically significant differences were found in running behaviour and patterns according to the positioning of the competitors. However, variables such as the braking zone, braking type, stability, line, and curve remained interdependent, likely due to the approach strategy for each curve. It is essential to explore other circuits to determine whether this phenomenon is specific to Kozakov or whether it can be generalised to other circuits with similar or different characteristics.
The observation tool (OSKATE) proposed in this paper has proven to be useful for analysing riders’ behaviours in competition and can help to adapt training according to their needs.Specialists in this discipline are recommended to use the OSKATE tool.
For future research, the use of more cameras and viewing angles, as well as telemetric data, could substantially improve the understanding of competitors’ behavioural patterns, although this would require significant financial investment.
Acknowledgements
The authors are grateful for the recognition of the National Institute of Physical Education of Catalonia (INEFC). The Department of Research and Universities of the Generalitat de Catalunya, and the Research and Innovation in Design Group (GRID). Technology and multimedia and digital application to observational designs (Code: 2021 SGR 00718). The Spanish government’s project: Integration between observational data and data from external sensors: Evolution of the LINCE PLUS software and development of the mobile application for the optimisation of sport and health-enhancing physical activity (EXP7474847) (2023). Ministry of Culture and Sport (CSD). The University of Lleida and the Human Movement Research Group (2021 SGR 01619).
References
[1] Aixa-Requena, S. (2024). Accions en el downhill skateboarding de competició. CORA. Repositori de Dades de Recerca, V1. Universitat de Barcelona. doi.org/doi:10.34810/data1346
[2] American Psychological Association. (2017). Ethical principles of psychologists and code of conduct. www.apa.org/ethics/code
[3] Amtmann, J., Loch, K., Todd, C. S. & Spath, W. (2013). Heart Rate Effects of Longboard Skateboarding. Intermountain Journal of Sciences, 19(1–4), 22–27.
[4] Anguera, M. T. & Blanco, A. (2003). Registro y codificación en el comportamiento deportivo. Psicología del Deporte, 2, 6–34.
[5] Anguera, M. T., Blanco, A., Hernández, A. & Losada, J. L. (2011). Diseños Observacionales: Ajuste y aplicación en psicología del deporte. Cuadernos de Psicología del Deporte, 11(2), 63–76.
[6] Anguera, M. T., Jonsson, G. K., Escolano-Pérez, E., Sánchez-Lopez, C. R., Losada, J. L. & Portell, M. (2023). T-pattern detection in the scientific literature of this century: A systematic review. Frontiers in Psychology, 14. doi.org/10.3389/fpsyg.2023.1085980
[7] Bakeman, R. & Quera, V. (2011). Sequential Analysis and Observational Methods for the Behavioral Sciences. Cambridge University Press. doi.org/10.1017/CBO9781139017343
[8] Barthel, S. C., Buckingham, T. M., Haft, C. E., Bechtolsheimer, J. E., Bechtolsheimer, T. A. & Ferguson, D. P. (2020). A Comparison of the Physiological Responses in Professional and Amateur Sports Car Racing Drivers. Research Quarterly for Exercise and Sport, 91(4), 562–573. doi.org/10.1080/02701367.2019.1690120
[9] Board, W. J. & Browning, R. C. (2014). Self-selected speeds and metabolic cost of longboard skateboarding. European Journal of Applied Physiology, 114(11), 2381–2386. doi.org/10.1007/s00421-014-2959-x
[10] Camerino, O., Prieto, I., Lapresa, D., Guitérrez, A. & Hileno, R. (2014). Detección de T-patterns en la observación de deportes de combate. Revista de Psicología del Deporte, 23(1), 147–155.
[11] Castañer, M., Aiello, S., Prat, Q., Andueza, J., Crescimanno, G. & Camerino, O. (2020). Impulsivity and physical activity: A T-Pattern detection of motor behavior profiles. Physiology & Behavior, 219, 112849. doi.org/10.1016/j.physbeh.2020.112849
[12] Castañer, M. & Camerino, O. (2022). Enfoque dinámico e integrado de la motricidad (EDIM). De la teoría a la práctica. Edicions de la Universitat de Lleida.
[13] Filho, E., Di Fronso, S., Mazzoni, C., Robazza, C., Bortoli, L. & Bertollo, M. (2015). My heart is racing! Psychophysiological dynamics of skilled racecar drivers. Journal of Sports Sciences, 33(9), 945–959. doi.org/10.1080/02640414.2014.977940
[14] Hart, J. H., Allen, T. & Holroyd, M. (2010). Downhill skateboard aerodynamics. Procedia Engineering, 2(2), 2523–2528. doi.org/10.1016/j.proeng.2010.04.026
[15] Heilmeier, A., Graf, M. & Lienkamp, M. (2018). A Race Simulation for Strategy Decisions in Circuit Motorsports. 2018 21st International Conference on Intelligent Transportation Systems (ITSC), 2018-Novem, 2986–2993. doi.org/10.1109/ITSC.2018.8570012
[16] Jasp Team. (2024). JASP (Version 0.18.1)[Computer software]. jasp-stats.org/.
[17] Kamberg, M.-L. (2017). Longboarding (1st ed.). The Rosen Publishing Group.
[18] Lappi, O. (2022). Egocentric Chunking in the Predictive Brain: A Cognitive Basis of Expert Performance in High-Speed Sports. Frontiers in Human Neuroscience, 16, 822887. doi.org/10.3389/fnhum.2022.822887
[19] Ledesma, C., Choo, W. & Hale, P. (2015). Real-time decision making in motorsports : analytics for improving professional car race strategy. Massachusetts Institute of Technology.
[20] Löckel, S., Kretschi, A., van Vliet, P. & Peters, J. (2022). Identification and modelling of race driving styles. Vehicle System Dynamics, 60(8), 2890–2918. doi.org/10.1080/00423114.2021.1930070
[21] Magnusson, M. S. (2017). Theme6Edu (Version 08.06.2017) [Computer software]. www.patternvision.com.
[22] Magnusson, M. S. (2020). T-Pattern Detection and Analysis (TPA) With THEMETM: A Mixed Methods Approach. Frontiers in Psychology, 10, 2663. doi.org/10.3389/fpsyg.2019.02663
[23] Pereira da Silva, R., Henrique, L., Nascimento, K., Henrique, L., Guedes, K. M., Junior, D. P. G. & Madureira, F. (2017). Efeito de Oito Semanas de Treinamento de Força na Performance do Gesto Motor “Tuck” ous Base em Atletas Profissionais de Downhill Speed Skate Stand-up. Revista Científica de Saúde, 1(2), 1–14.
[24] Platzer, H. P., Raschner, C., Patterson, C. & Lembert, S. (2009). Comparison of physical characteristics and performance among elite snowboarders. Journal of Strength and Conditioning Research, 23(5), 1427–1432. doi.org/10.1519/JSC.0B013E3181AA1D9F
[25] Powell, C. (2007). The Perception of Risk and Risk Taking Behavior: Implications for Incident Prevention Strategies. Wilderness & Environmental Medicine, 18(1), 10–15. journals.sagepub.com/doi/full/10.1580/10806032(2007)18[10:TPORAR]2.0.CO;2
[26] Prentiss, A. M., Skelton, R. R., Eldredge, N. & Quinn, C. (2011). Get Rad! The Evolution of the Skateboard Deck. Evolution: Education and Outreach, 4(3), 379–389. doi.org/10.1007/s12052-011-0347-0
[27] Prieto, I., Gutiérrez, A., Camerino, O. & Anguera, M. T. (2016). Typical Errors and Behavioral Sequences in Judo Techniques: Knowledge of Performance and the Analysis of T-Patterns in Relation to Teaching and Learning the Ouchi-Gari Throw. In Neuromethods (Vol. 111, pp. 143–153). Humana Press Inc. doi.org/10.1007/978-1-4939-3249-8_7
[28] Reid, M. B. & Lightfoot, J. T. (2019). The Physiology of Auto Racing. Medicine and Science in Sports and Exercise, 51(12), 2548–2562. doi.org/10.1249/MSS.0000000000002070
[29] Russell, K. W., Katz, M. G., Short, S. S., Scaife, E. R. & Fenton, S. J. (2019). Longboard injuries treated at a level 1 pediatric trauma center. Journal of Pediatric Surgery, 54(3), 569–571. doi.org/10.1016/j.jpedsurg.2018.10.098
[30] Soto, A., Camerino, O., Iglesias, X., Anguera, M. T. & Castañer, M. (2019). LINCE PLUS: Research Software for Behavior Video Analysis. Apunts Educació Física i Esports, 137, 149–153. doi.org/10.5672/apunts.2014-0983.es.(2019/3).137.11
[31] Soto, A., Camerino, O., Iglesias, X., Anguera, M. T. & Castañer, M. (2022). LINCE PLUS software for systematic observational studies in sports and health. Behavior Research Methods, 54(3), 1263–1271. doi.org/10.3758/s13428-021-01642-1
[32] Tuhkanen, S., Pekkanen, J., Wilkie, R. M. & Lappi, O. (2021). Visual anticipation of the future path: Predictive gaze and steering. Journal of Vision, 21(8), 25. doi.org/10.1167/jov.21.8.25
[33] Vernillo, G., Pisoni, C. & Thiébat, G. (2018). Physiological and physical profile of snowboarding: A preliminary review. Frontiers in Physiology, 9(JUN), 373447. doi.org/10.3389/fphys.2018.00770
ISSN: 2014-0983
Received: 20 de septiembre de 2024
Accepted: 26 de noviembre de 2024
Published: 1 de abril de 2025
Editor: © Generalitat de Catalunya Departament de la Presidència Institut Nacional d’Educació Física de Catalunya (INEFC)
© Copyright Generalitat de Catalunya (INEFC). This article is available from url https://www.revista-apunts.com/. This work is licensed under a Creative Commons Attribution-NonCommercial-NoDerivatives 4.0 International License. The images or other third party material in this article are included in the article’s Creative Commons license, unless indicated otherwise in the credit line; if the material is not included under the Creative Commons license, users will need to obtain permission from the license holder to reproduce the material. To view a copy of this license, visit https://creativecommons.org/licenses/by-nc-nd/4.0/deed.en


