Technical-associative Analysis of the Centre in Winning and Losing Handball Teams
Mario Amatria-Jiménez
Rubén Maneiro
José Enrique Moral-García

Sergio López-García
*Corresponding author: José Enrique Moral-García jemoralga@upsa.es
Cite this article
Amatria, M., Maneiro, R., Moral-García, J.E., López-García, S. (2020). Technical-associative Analysis of the Centre in Winning and Losing Handball Teams. Apunts. Educación Física y Deportes, 142, 46-54. https://doi.org/10.5672/apunts.2014-0983.es.(2020/4).142.06
Abstract
Winning is the ultimate goal of high-performance sports. In handball, a sport in which the number of goals scored is high, identifying the small details and the factors that lead to the team’s success is of particular importance to elite athletics. The objective of this study is to identify the technical differences and levels of association with teammates evinced by centres in teams who win and lose in their offensive phase. For this purpose, an observational methodology was used, taking all the offensive actions of the centres in all the matches played during the 2017-2018 Asobal Cup as the sample and creating an ad-hoc instrument called the Inob-FOB to record the data. The validity of the instrument was developed within the Theory of Generalisability (TG). Pearson’s chi-squared statistic and polar coordinates were used to analyse the data. The absence of significant differences in the different technical moves analysed (throws: p < .947, assists: p < .408, executions without loss: p < .153, goals scored: p < .408) and the results obtained from the polar coordinates analysis reveal that the differences between the players in this position (centres) in teams that win and lose lie in their collective association rather than in their technical performance. These results are relevant for coaches at different competitive levels, since they indicate the type of training they should undertake to improve their teams’ collective performance.
Introduction
In recent years, huge strides in performance levels have been made in the practice of handball due to the evolution of playing systems, as well as the attainment of higher levels of professionalisation in the technical staff and players. As a result, the level of play in the different championships in this sport has improved exponentially (Prudente et al., 2017).
As one of the sports with most practitioners in Europe (Prieto et al., 2015), handball has always aroused – and continues to do so – the scientific community’s interest in studying and analysing it from a variety of paradigms. Recently, match analysis is one of the most common paradigms used (Amatria et al., 2020; Daza, 2010; Gutiérrez et al., 2014; Lozano & Camerino, 2012; Lozano, 2014; Lozano et al., 2016, Martín et al., 2012; Montoya, 2010).
The match analysis paradigm encompasses different studies of the positions, technical aspects and tactics during matches or competitions. Since handball is a game in which the players try to score goals (the team with at least one goal more than their rival wins), all the actions and elements involved in the development of any offensive action are relevant and are therefore worth studying.
Part of the evolution that the game has experienced can be seen explicitly in the increasing importance of the frontline players (Montoya et al., 2017), with the player at the centre, aptly called the centre, being tasked with directing and guiding the team’s offensive actions and thus playing a key role in interpreting the match and its collective development (Flores & Anguera, 2018).
For all these reasons, and because of the important repercussions of discovering the associative and technical-tactical relations that take place among players on the same team in achieving a high performance (Hristovski et al., 2017), the objective of this study is to compare the technical performance (technical moves by the player in the offensive phase) and associative performance (relationships of cooperation, support and association during the offensive phase) of the players occupying the specific position of centre in high-performance handball on both the winning and losing teams in a highly competitive tournament played for a brief period of time, namely the 2017-2018 Asobal Cup.
Methodology
An observational methodology was used to conduct this study, as it is one of the most highly recommended methods for observing sports, because it studies the spontaneous behavioural interactions of the athletes in their natural setting (Anguera & Hernández-Mendo, 2015).
The design of this study was punctual, with intra-session, multidimensional and ideographic follow-up (Anguera et al., 2011); similarly, observation was governed by scientific criteria with total perceptivity and a non-participant observer.
Participants
The participants were chosen through intentional or convenience observational sampling (Anguera et al., 2011) which included all the players in the position of centre (9 centres) in all the teams participating in the 2017-2018 Asobal Cup (4 teams)..
Observation instrument
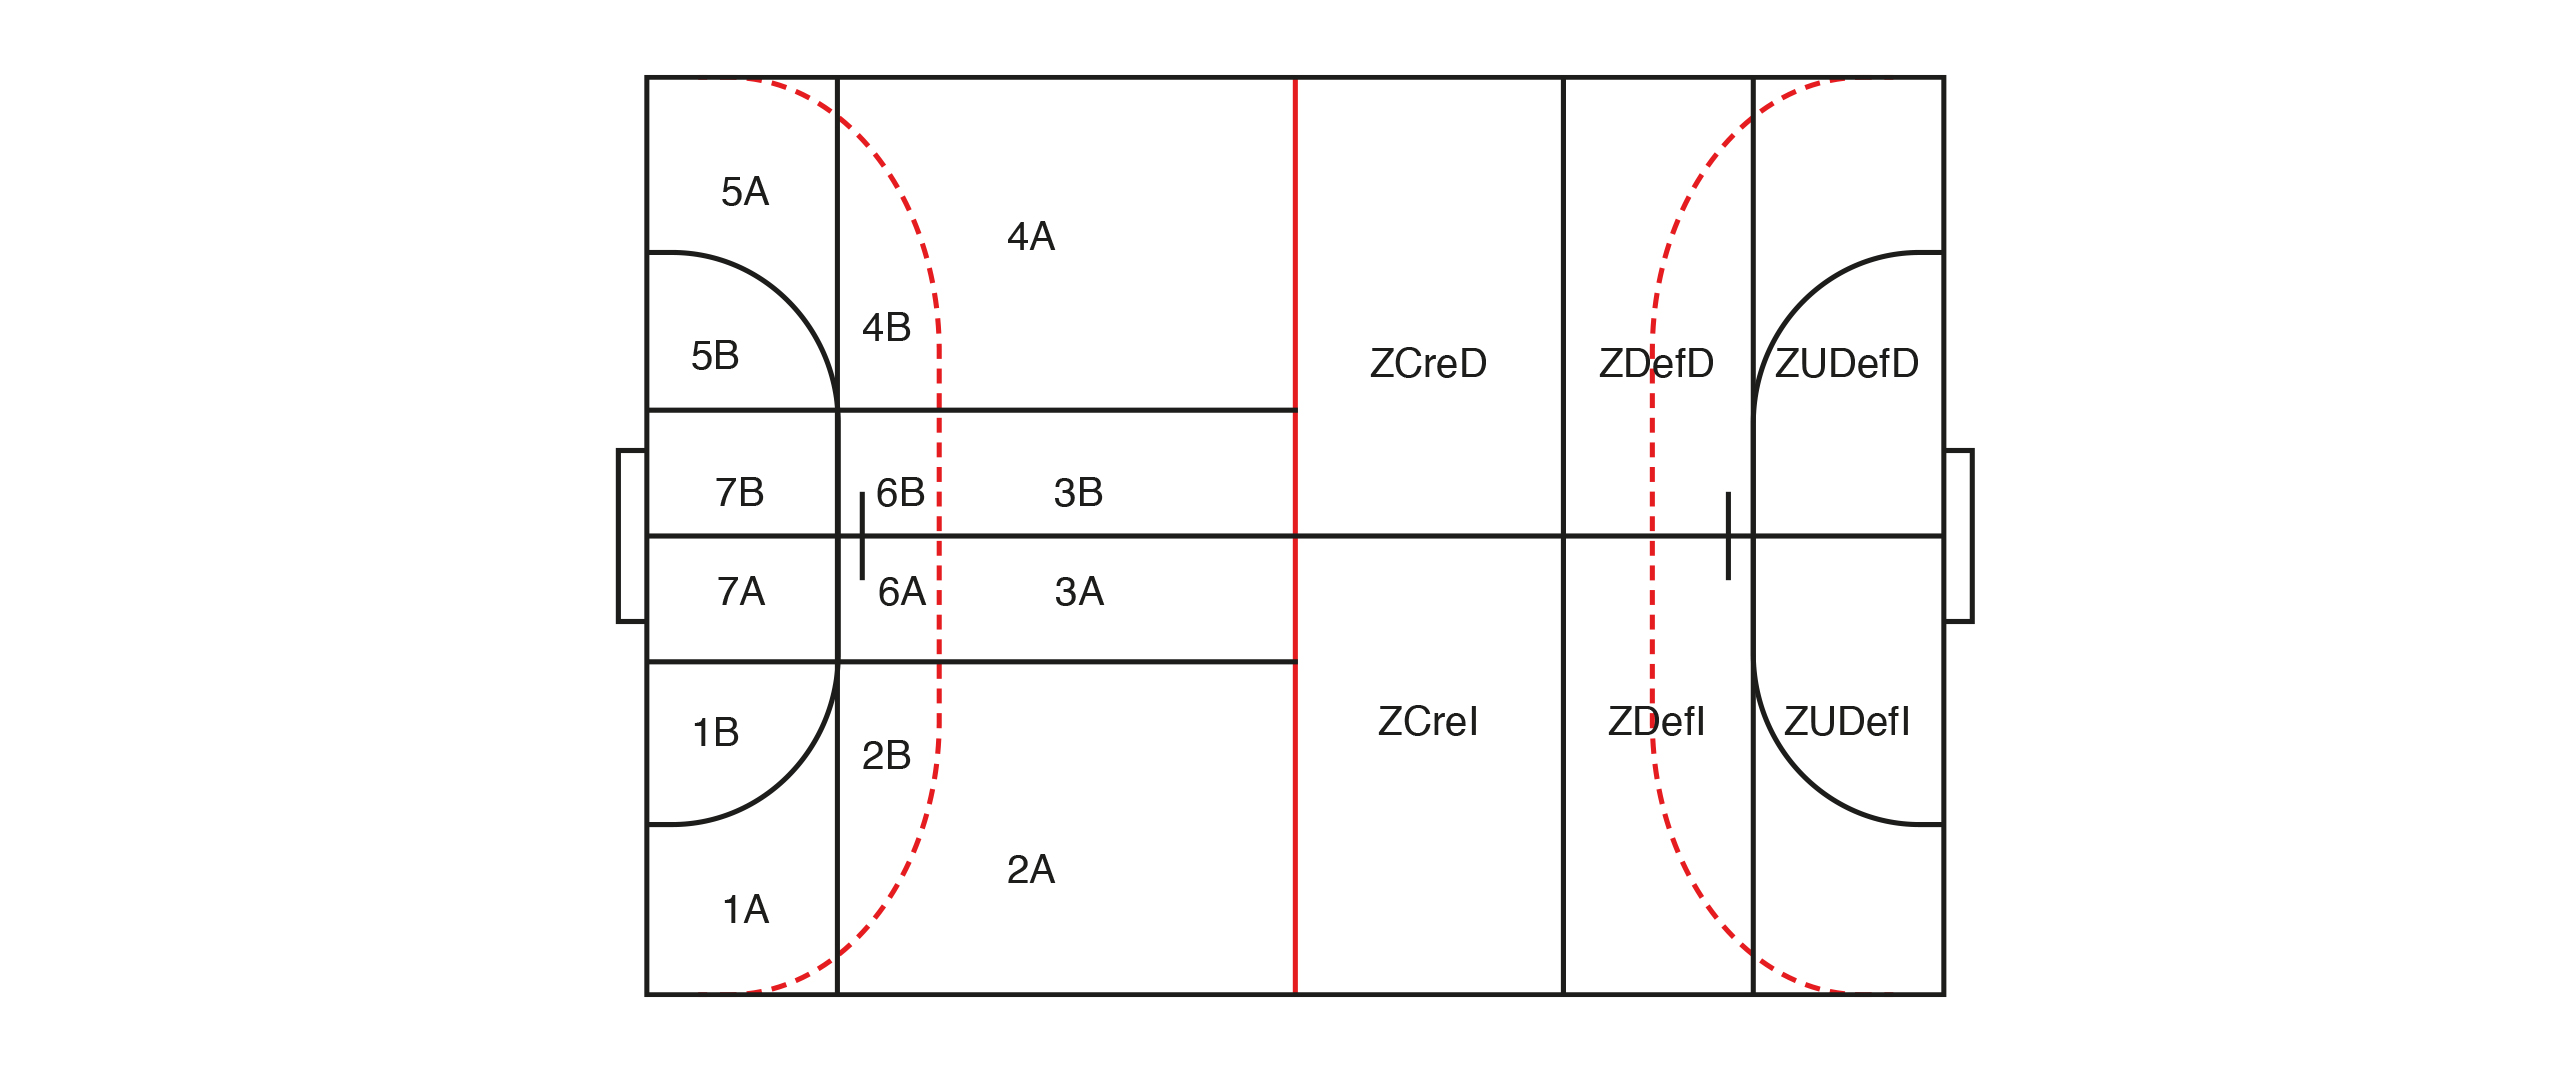
The observation instrument used to conduct this study was developed ad hoc for this research and is called the Observation Instrument of the Offensive Phase in Handball (or InOb-FOB; InOb-FOB; Table 1). It combines a field format and category systems (Anguera, et al. 2007), with each one of these systems fulfilling the characteristics of exhaustiveness and mutual exclusivity, as they are nested in the different field formats. Figure 1 shows the map used for the spatial distribution of this instrument.

Table 1
InOb-FOB observation instrument.
Recording instrument
Version 1.2.1 of the Lince programme (Gabin et al., 2012) was used to record the data, which are type IV, that is, concurrent and base-time (Anguera, et al. 2011).
Quality control of the data
Data quality was controlled by comparing the records made by two observers quantitatively. Both observers fulfilled the requirements established for recording data by holding a Bachelor’s in Physical Activity and Sport Sciences and being handball experts. Similarly, training was provided before the final data recording following the recommendations of Anguera (2003). It should be noted that the recording by the second observer comprises 10% of all the offensive moves. To determine the reliability of the data obtained from the observation instrument, an analysis was applied to find the Cohen’s Kappa statistic (1960), whose result quantifies the degree of concordance between the observers while correcting for the randomness factor. The Kappa coefficient was calculated using version 5.1 of the GSEQ computer programme, considering the recommendations of Bakeman and Quera (2011), yielding a concordance value of .90 between the records.
The Theory of Generalisability (TG) was used with version 1.0 of the SAGT software (Hernández Mendo et al., 2016). The phases established by Blanco-Villaseñor (1993) were used for the purpose of designing it, with a two-facet crossed observational plan (3 matches and 181 categories), establishing an infinite universe of data generalisability with a mean of two plans: (Category/Match) to evaluate the generalisability of the results through the number of matches observed, and (Match/Category) to evaluate the validity of the observation instrument created and used by means of TG; the 4th phase, the optimisation plan, proved to be unnecessary.
In the first observational plan (Category/Match), Table 2, the Categories facet presents the highest percentage (78.029%), followed by the interaction of the facets (21.971%). The results of the analysis of this measurement plan confirm the homogeneity of the matches in the observational sample with a relative G coefficient (e2) = .914.
Table 2
Results of the measurement plan (Category/Match).
Based on these results, when the “Category” facet is established in the instrumentation facet, the validity of the instrument is verified. Following Lapresa et al. (2020), the instrument is valid when the variability of the “Categories” facet is very high, which means that it is valid when it yields a relative G coefficient equal to or very close to 0. In this case, the relative G coefficient (e2) is .000.
Data analysis
a) Data analysis by means of the search for the associative relationship between categorical variables
Pearson’s chi-squared statistic (χ²) was used to ascertain the degree of association between the different variables to be analysed, with statistical significance established when the value is p < .05.
Version 20.0 of the SPSS statistical package was used to conduct these non-parametric inferential statistics.
b) Data analysis by means of polar coordinates
Polar coordinates are an analysis technique used recently in the study of the sport sciences (Anguera & Hernández-Mendo, 2015). This analytical technique was developed by Sackett (1980) and improved by Anguera (1997), based on Cochran’s Q test (1954). This Q test statistic can be used to measure associative consistency between different behaviours, allowing the relationship of activation or inhibition of the conditioning (focal) behaviour and the related behaviours (conditioned behaviours) to be identified. This analysis is conducted both prospectively and retrospectively, yielding a vector for each behaviour related to a given angle and radius. According to the result of the angle, the vector is located in a specific quadrant of the four that comprise this type of analysis. Each quadrant enables us to interpret the relationship between the focal behaviour and the conditioned behaviour. Specifically, vectors in the first quadrant (quadrant I, from 0º to 90º) indicate that both behaviours, focal and conditioned, are reciprocally activated; vectors that appear in the second quadrant (quadrant II, from +90º to 180º) show that the focal behaviour inhibits the conditioned behaviour, but not the opposite; vectors located in the third quadrant (quadrant III, from +180º to 270º) indicate that both behaviours, focal and conditioned, inhibit each other mutually; and vectors in the fourth quadrant (quadrant IV, from +270º to 360º) indicate that the focal behaviour activates the conditioned behaviour but not the opposite.
In this analysis, version 1.5 of the Gseq software was used (Bakeman & Quera, 2011) to conduct the sequential analysis of delays, and subsequently version 1.2 of the Hoisan programme (Hernández-Mendo et al., 2012), where the data obtained in Gseq v5.1 were analysed to obtain the polar coordinates. The computer application Hoisan_to_R, developed by Rodríguez et al., (2019), was used to graphically display the results.
Results
Of the 486 offensive actions analysed, 77% included intervention by the centres, with an intervention percentage of 76.7% in matches in which the team lost and 77.3% in the matches in which the team won.
a) Results of the data analysis by means of the search for the associative relationship between categorical variables
In terms of the number of successful interventions by centres, no significant differences were found (v = 2.042; gl = 1; p < .153) between the outcome of the matches (loss or win) and the success of the technical actions undertaken (success or failure).
On examining the last pass made prior to the centres’ execution of a throw on goal, no significant differences were found (v = .689; gl = 1; p < .406) between the end result of the matches (loss or win) and the last pass made prior to a throw on goal (yes or no).
In terms of the number of assists made by the centres, defined as the last pass before a goal, no significant differences were found (v = .684; gl = 1; p < .408) between the outcome of the matches (loss or win) and whether the centre assisted a goal (yes or no).
In relation to the types of throws on goal executed by the centres, no significant differences were found (v = .733; gl = 4; p < .947) between the outcome of the matches (loss or win) and the throws executed.
Finally, no significant differences were found (v = .684; df = 1; p < .408) between the outcome of the matches (loss or win) and the goals scored in terms of the goals scored by the centres.
Table 3
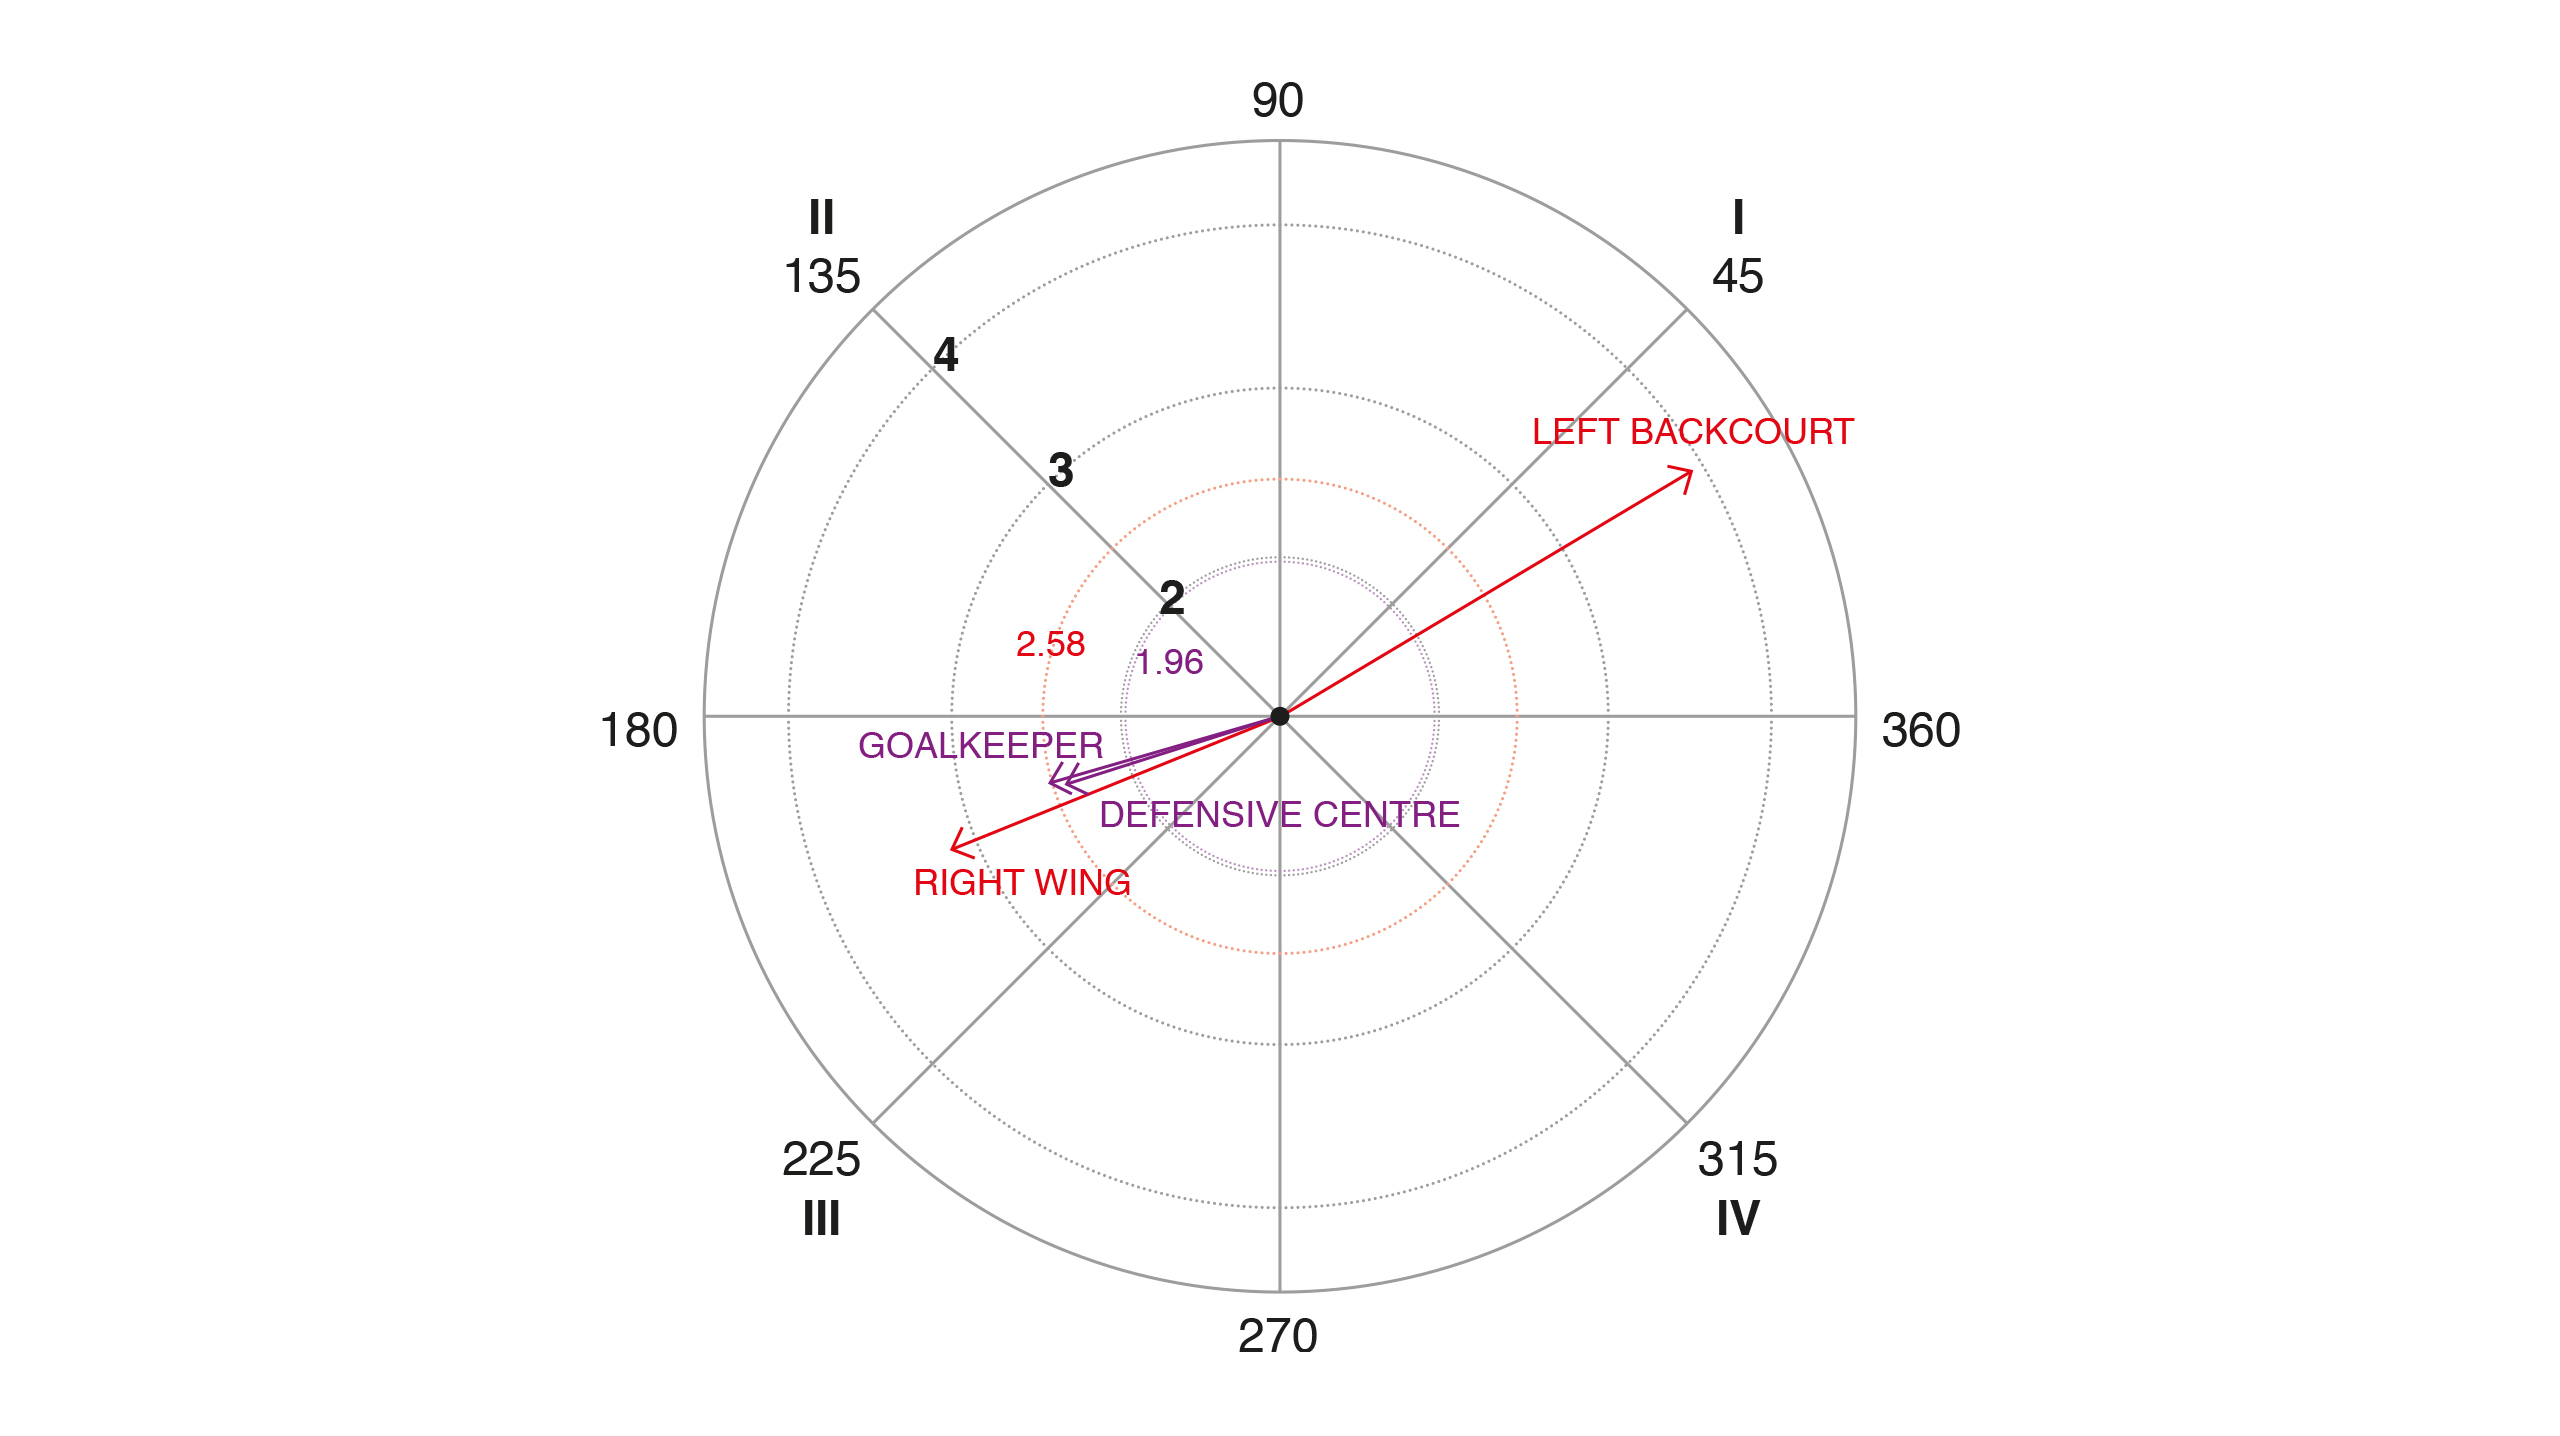
Results of the analysis of polar coordinates for the CNT, centre focal category, in relation to the other positions when the centre’s team wins.
b) Results of the analysis by means of polar coordinates
To conduct this analysis, the CN-centre focal behaviour was related to the other categories that comprise the team structure (PT, LTI, LTD, PV, EI, ED and CNTD). This analysis sought to identify the significant relationships of association found between the centres and their teammates.
With regard to the matches won by the centres’ teams, the results (Table 3 and Figure 2) present the LTD-right backcourt criterion category with a radius of 5.86 and an angle of 30.87º and the LTI-left backcourt criterion category with a radius of 3.77 and an angle of 37.63, both vectors in quadrant I, where the focal behaviour activates the presence of the conditioned behaviour both prospectively and retrospectively.
Similarly, the vectors corresponding to the POR-goalkeeper, EXD-right wing and CNTD-defensive centre categories with radii of 2.2, 3.28 and 2.15 and angles of 197.51º, 201.08º and 199.15º, respectively, are all in quadrant III, where the focal behaviour inhibits the presence of the pairing behaviour, prospectively and retrospectively.
In terms of the matches where the centres’ teams lose, Table 4 and Figure 3 show the LTD-right backcourt criterion category with a radius of 5.72 and an angle of 31.12º in quadrant I, where the focal behaviour activates the presence of the conditioned behaviour both prospectively and retrospectively.
The PIV-pivot category has a radius of 2.72 and an angle of 161.09º and the POR-goalkeeper category has a radius of 2.61 and an angle of 163.27º, both of them in quadrant II, where the behaviour criterion inhibits the presence of the pairing behaviour prospectively and activates it retrospectively.
Finally, the LTI-left backcourt category presents a radius of 2.61 and an angle of 163.27º, in quadrant III, where the focal behaviour inhibits the presence of the pairing behaviour, prospectively and retrospectively.
Table 4
Results of the polar coordinates analysis for the CNT, centre focal category, in relation to the other positions when the centre’s team loses.
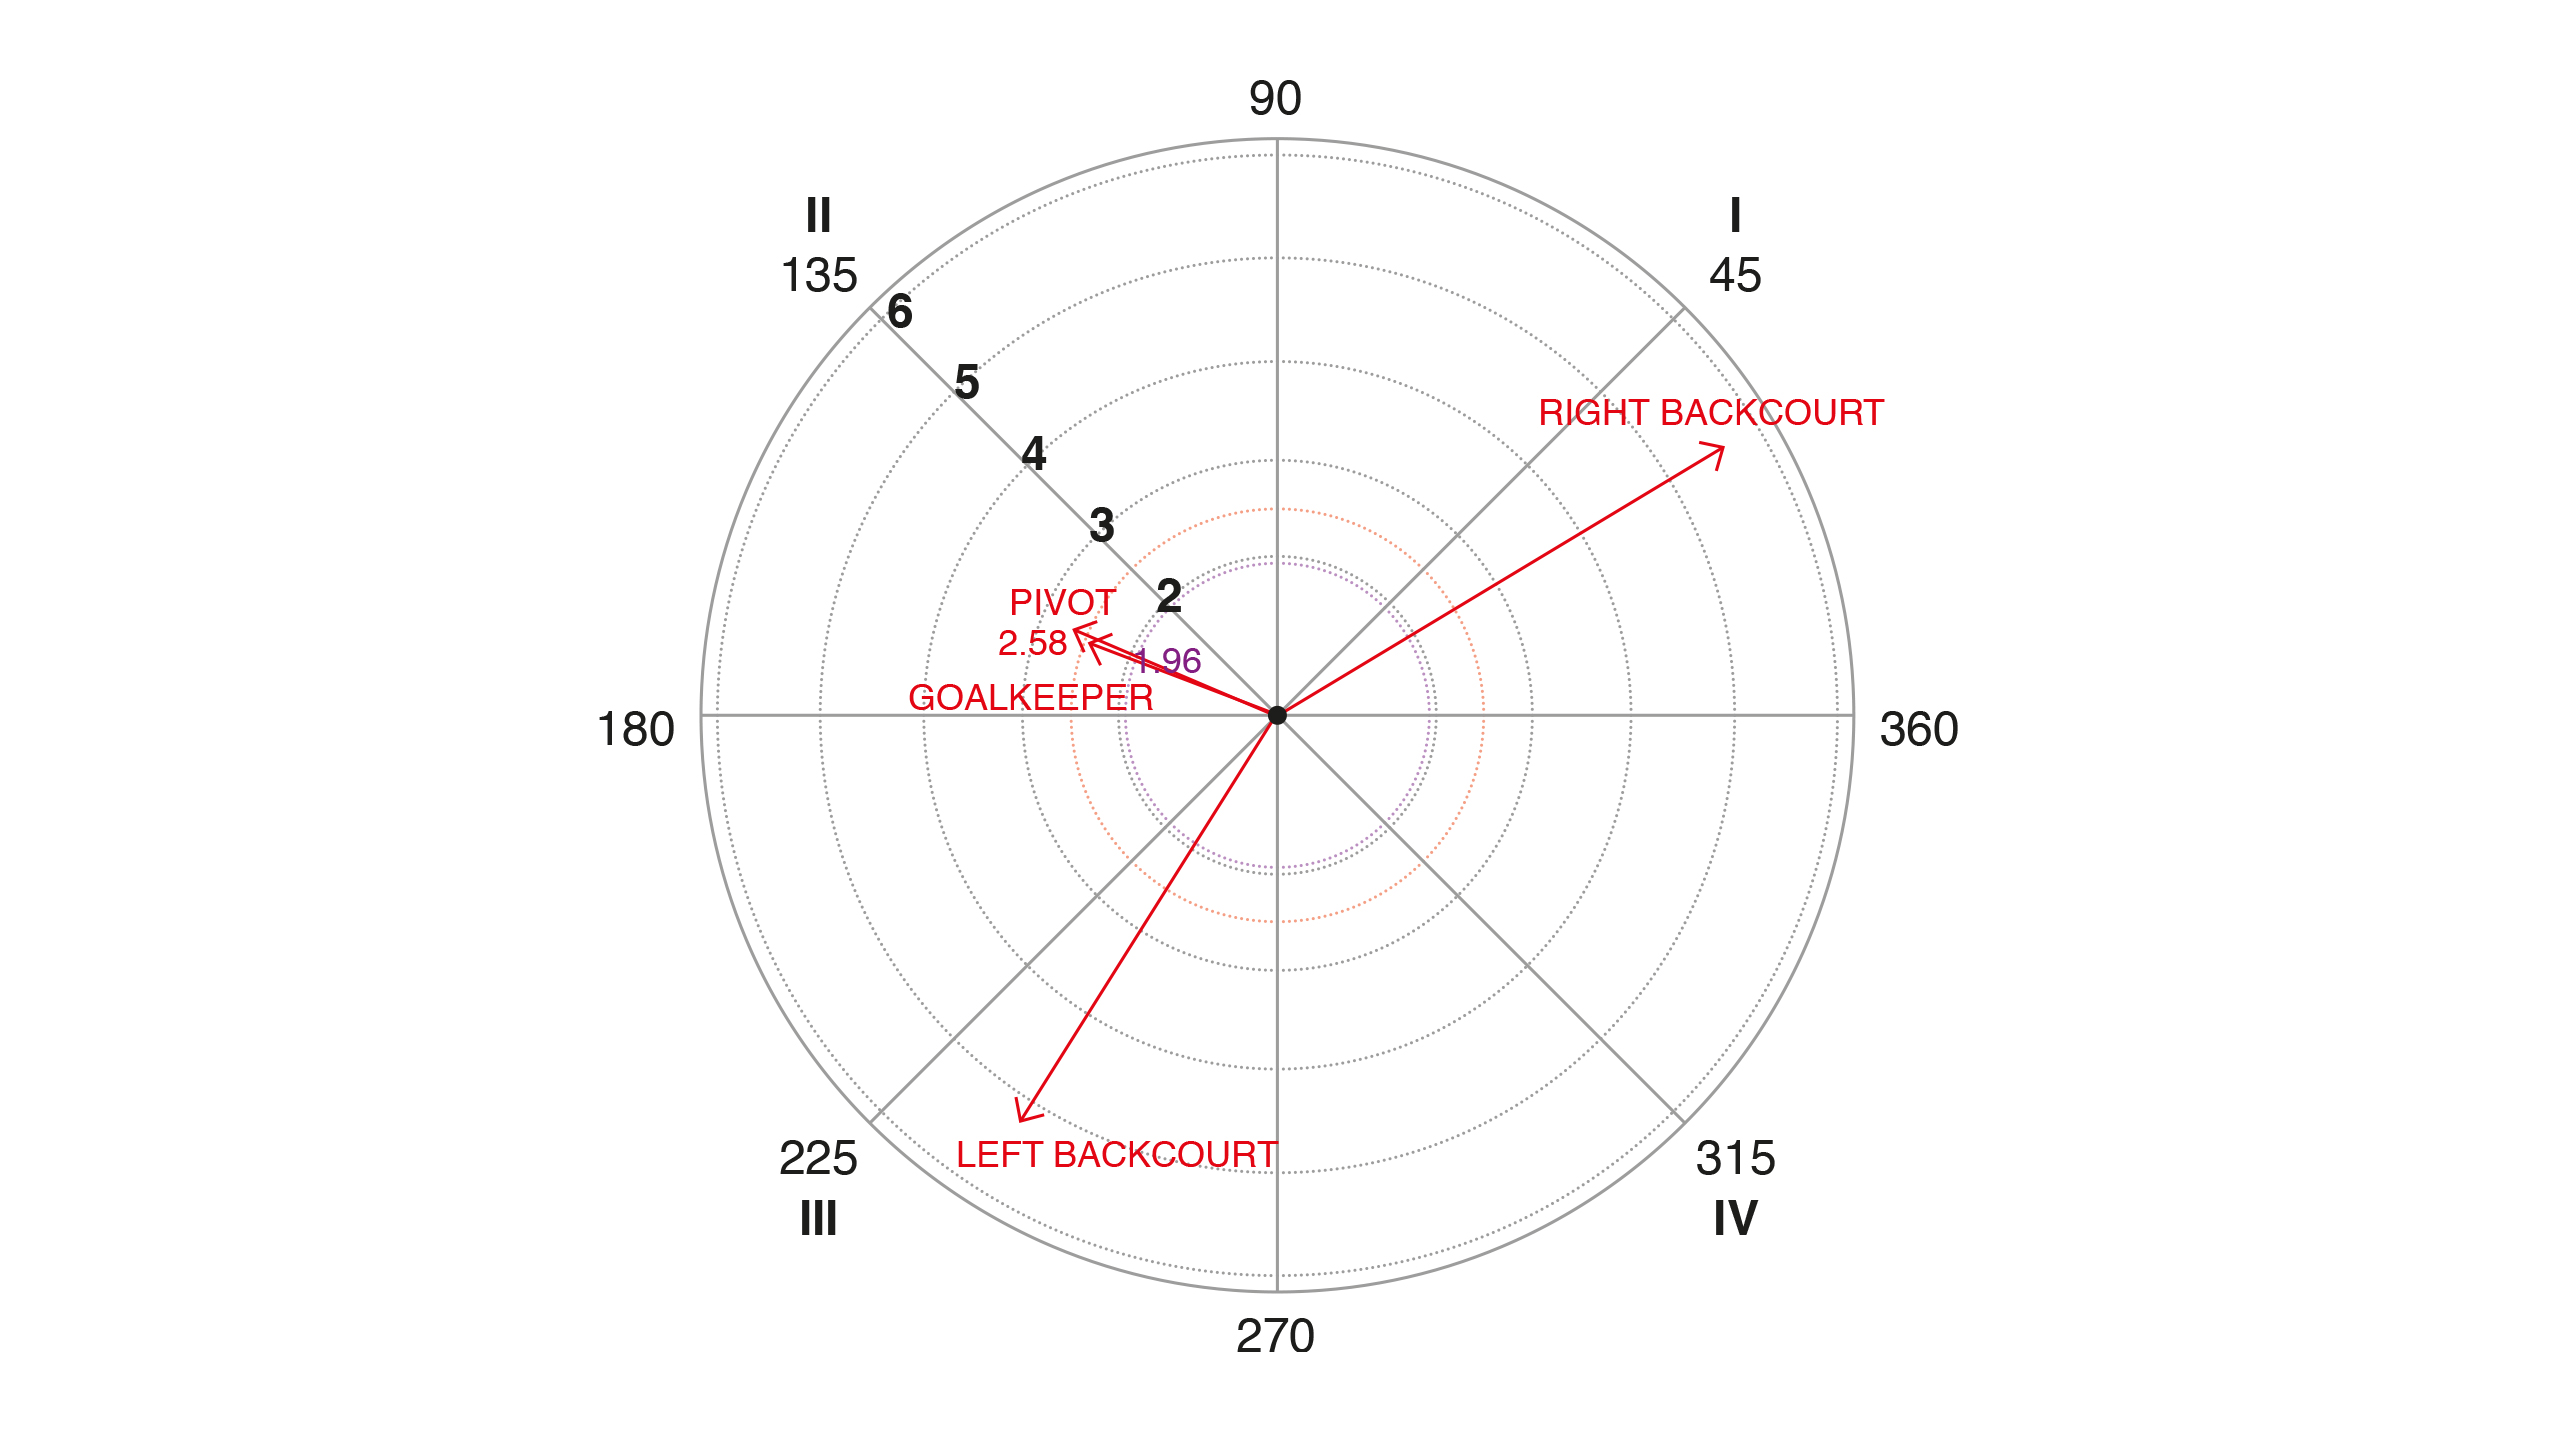
Representation of the behavioural map establishing the CNT, centre category, as the focal behaviour in relation to the other positions when the centre’s team loses.
Discussion
When the intervention and participation of centres in winning and losing teams were compared, no significant differences were found in the execution or effectiveness of throws. These results concur with those found by Vuleta, et al. (2003), who determined that efficiency of throws is a distinguishing feature between winning and losing teams.
In terms of technical moves, neither were there significant differences between the centres in the winning and losing teams, which denoted a high degree of technical performance. This was in line with the study by Bilge (2012), which describes the model of play of European handball with a high level of performance and technical variation, and the fact that there were more and more versatile players with higher technical prowess, especially centres. The centres presented higher motor skills (Zapartidis et al., 2011), which concurred with the findings of Foretić et al. (2010), who concluded that throwing efficiency is a feature that sets winning teams apart from losing teams, with the wings and the pivot being the crucial positions in winning.
Furthermore, these positions were associated with the fundamental construction of play (Flores & Anguera, 2018). For this reason, the execution of the last pass prior to the throw, as well as assists before the goal, were core elements in centres’ playing performance. In this sense, the absence of significant differences when centres in the winning and losing teams were compared revealed their evident presence in the construction and finalisation of offensive play, in consonance with the results obtained by Gutiérrez and López (2011), whose study analysing the specific positions of the players in the Asobal league identified the importance of the centre in the team’s offensive play.
In terms of associative tactics, differences were found in the centres of the winning and losing teams; more specifically, the centres of the winning teams were seen to have a relationship of reciprocal activation with the other players in the frontline of attack (left and right backcourt), affording their game greater variability and complexity and allowing them to make offensive actions by executing and developing complex tactics such as complex tactical procedures and complex tactical circulations, which help to throw the rival defence into disarray. These results match the game patterns found by Flores and Anguera (2018) in their analysis at international levels. It should be noted that the association shown by the centres of losing teams is focused on a single side, meaning that not only do they not use the entire breadth of the court as a resource for tactical performance, but also that their play was predictable and was conducive to defensive action by the rival team.
Conclusion
There are no technical differences or differences in assists, throws or goals between the centres in winning and losing teams, but there are differences when the way they combine with the other players in the team is analysed, with a broader variety of combinations on the part of the centre being found in winning teams, affording greater width and depth to their game by linking up with the accompanying left and right backcourts. However, in losing teams, the centre’s combination play focuses on just one side, in this case the right, namely with the right backcourt player.
This study is important for coaches in all categories, given that it helps them to focus their efforts on the degree of combination with teammates and improves their understanding and interpretation of the game, while also suggesting specific tasks in which the offensive game uses the entire width and depth of the court, improving the team’s collective performance, rather than simply focusing on the centres’ technique at professional level.
Future research into centres’ in-game play should be geared towards the collective effect of their movements and the latter’s timing, while also taking the rival team’s defensive technical and tactical performance into account.
Acknowledgements
The authors wish to express their gratitude for the assistance of the Mixed Method Approach in the Analysis of Performance (in training and competition) in Elite and Academic Sport sub-project from the Ministry of Science, Innovation and Universities (MCIU) PGC2018-098742-B-C33] (2019-2021), the State Research Agency (AEI) and the European Regional Development Fund (ERDF), which is part of the New Approach of Research in Physical Activity and Sport from Mixed Methods Perspective (NARPAS_MM) [SPGC201800X098742CV0] coordinated project.
References
[1] Amatria, M., Lapresa, D., Martín Santos, C., & Pérez Túrpin, J.A. (2020) Offensive Effectiveness in the Female Elite Handball in Numerical Superiority Situations. Revista Internacional de Medicina y Ciencias de la Actividad Física y el Deporte vol. 20 (78) pp. 227-242. doi.org/10.15366/rimcafd2020.78.003
[2] Anguera, MT. (1997). From prospective patterns in behavior to joins analysis with retrospective perspective. Colloque sur invitation “Methodologie dánalyse des inteactions sociales” Université de la Sorbonne. Paris.
[3] Anguera, MT. (2003). La observación. In C. Moreno Rosset (Ed.), Evaluación psicológica. Concepto, proceso y aplicación en las áreas del desarrollo y de la inteligencia (p. 271-308). Madrid: Sanz y Torres.
[4] Anguera, M. T., & Hernández-Mendo, A. (2015). Técnicas de análisis en estudios observacionales en ciencias del deporte. Cuadernos de Psicología del Deporte, 15(1), 13-30.
[5] Anguera, M.T., Blanco-Villaseñor, A., Hernández-Mendo, A., & Losada, J.L. (2011). Diseños observacionales: Ajuste y aplicación en psicología del deporte. Cuadernos de Psicología del Deporte, 11(2), 63-76
[6] Anguera, M. T., Magnusson, M. S., & Jonsson, G. K. (2007). Instrumentos no estándar. Avances en Medición, 5(1), 63-82
[7] Bakeman, R., & Quera, V. (2011). Sequential Analysis and Observational Methods for the Behavioral Sciences. Cambridge: Cambridge University Press
[8] Bilge, M. (2012). Game Analysis of Olympic, World and European Championships in Men’s Handball. Journal of Human Kinetics, 35, 109–118. doi.org/10.2478/v10078-012-0084-7
[9] Blanco-Villaseñor, A. (1993). Fiabilidad, precisión, validez y generalizabilidad de los diseños observacionales. In M. T. Anguera (Ed.), Metodología observacional en la investigación psicológica (Vol. II, p. 151-261). PPU.
[10] Cochran, W.G. (1954). Some methods for strengthening the common test. Biometrics, 10, 417-451
[11] Cohen, J. (1960). A coefficient of agreement for nominal scales. Educational and Psychological Measurement, 20, 37-46
[12] Daza, G. (2010). Las habilidades del pivote en la alta competición del balonmano (Doctoral dissertation). Universitat de Barcelona, Barcelona.
[13] Flores, J., & Anguera, M.T. (2018) Game Pattern in Handball According to the Player who Occupies the Centre Back Position. Apunts. Educación Física y Deportes 134(4º trim), 110-123. doi.org/10.5672/apunts.2014-0983.cat.(2018/4).134.08
[14] Gabin, B., Camerino, O., Anguera, M. T., & Castañer, M. (2012). Lince: Multiplatform sport analysis software. Procedia. Social and Behavioral Sciences, 46, 4692-4694.
[15] Gutiérrez, D., Fisette, J., García-López, L. M., & Contreras, O. (2014). Assessment of secondary school students’ game performance related to tactical contexts. Journal of Human Kinetics, 42(1), 223-234. doi.org/10.2478/hukin-2014-0076.
[16] Gutiérrez, O., & López, P. (2011). Descriptive statistics for specific positions at Asobal Handball League. Marathon, 3(1). 1-7
[17] Hernández-Mendo, A., Blanco-Villaseñor, A., Pastrana, J. L., Morales-Sánchez, V., & Ramos-Pérez, F. J. (2016). SAGT: aplicación informática para análisis de generalizabilidad. Revista Iberoamericana de Psicología del Ejercicio y el Deporte, 11(1), 77-89
[18] Hernández-Mendo, A., López-López, J.A., Castellano, J., Morales-Sánchez, V., & Pastrana, J.L. (2012). Hoisan 1.2: programa informático para uso en metodología observacional. [Hoisan 1.2: Program for Use in Observational Methodology.] Cuadernos de Psicología del Deporte, 12(1), 55-78. doi.org/10.4321/S1578-84232012000100006
[19] Hristovski, R., Aceski, A., Balague, N., Seifert, L., Tufekcievski, A., & Cecilia, A. (2017). Structure and dynamics of European sports science textual contents: Analysis of ECSS abstracts (1996-2014). European Journal Sport Science, 17, 19-29. doi.org/10.1080/17461391.2016.1207709
[20] Lapresa, D., Blanco, F., Amatria, M., Arana, J., & Anguera, M. T. (2020). Observational Analysis of the Execution of the “Control” Core Technical/Tactical Concept by Sergio Busquets. Apunts. Educación Física y Deportes, 140, 52-62. doi.org/10.5672/apunts.2014-0983.es.(2020/2).140.08
[21] Lozano, D. (2014). Análisis del comportamiento táctico ofensivo en alto rendimiento en balonmano (Doctoral dissertation). Universidad de Lleida
[22] Lozano, D., & Camerino, O. (2012). Effectiveness of Offensive Systems in Handball. Apunts. Educación Física y Deportes, 108, 70-81. doi.org/10.5672/apunts.2014-0983.es.(2012/2).108.08
[23] Lozano, D., Camerino, O., & Hileno, R. (2016). Interacción dinámica ofensiva en balonmano de alto rendimiento. Apunts. Educación Física y Deportes, 125, 90-110. doi.org/10.5672/apunts.2014-0983.es.(2016/3).125.08
[24] Martín Tamayo, I., Cavalcanti Cabral, L. A., Chirosa Ríos, L. J., & Aguilar Sánchez, J. (2011). The PROTODEBA V1.0 Program: A Proposal for the Observation of Decision-Making in Handball. Apunts. Educación Física y Deportes, 104, 80-87. doi.org/10.5672/apunts.2014-0983.es.(2011/2).104.08
[25] Montoya, M. (2010). Análisis de las finalizaciones de los jugadores extremo en balonmano (Doctoral dissertation). Universidad de Barcelona, Barcelona.
[26] Montoya, M., Moras, G., & Anguera, M. T. (2013). Analysing Completions by Wing Players in Handball. Apunts. Educación Física y Deportes, 113, 52-59. doi.org/10.5672/apunts.2014-0983.es.(2013/3).113.05
[27] Prieto, J., Gómez, M. A., & Sampaio, J. (2015). From a Static to a Dynamic Perspective in Handball Match Analysis: a Systematic Review. The Open Sports Sciences Journal, 8, 25-34.
[28] Prudente, J., Sousa, D., Sequeira, P., López-López, J. A., & Hernández-Mendo, A. (2017). Analyzing the influence of playing time and partial score on the tactical behavior in the duel 2 vs 2 in the offensive process in handball, using the polar coordinates technique. Anales de psicología, 33(3), 515-529. doi.org/10.6018/analesps.33.3.271071
[29] Rodríguez-Medina, J., Arias, V., Arias, B., Hernández-Mendo, A., & Anguera, M. T. (2019). Polar Coordinate Analysis, from HOISAN to R: A Tutorial Paper. Unpublished manuscript. Retrieved from: jairodmed.shinyapps.io/HOISAN_to_R
[30] Sackett, G.P. (1980). Lag Sequential Analysis as a data Reduction Technique in Social Interaction Research. In D.B. Sawin, R.C. Hawkins, L.O. Walker, & J.H. Penticuff (Eds.), Exceptional infant. Phychosocial risks in infant-environment transactions (p. 300-340). New York: Brunner/Mazel
[31] Vuleta, D., Milanović, D., & Sertić, H. (2003). Relations among variables of shooting for a goal and outcomes of the 2000 Men’s Handball Championship matches. Kinesiology: international journal of fundamental and applied kinesiology 35. 168-183
[32] Zapartidis, I., Kororos, P., Christodoulidis, T., Skoufas, D., & Bayios, I. (2011). Profile of Young Handball Players by Playing Position and Determinants of Ball Throwing Velocity. Journal of Human Kinetics 27, 17-30. doi.org/10.2478/v10078-011-0002-4
ISSN: 2014-0983
Received: 4 December 2019
Accepted: 29 June 2020
Published: 1 October 2020
Editor: © Generalitat de Catalunya Departament de la Presidència Institut Nacional d’Educació Física de Catalunya (INEFC)
© Copyright Generalitat de Catalunya (INEFC). This article is available from url https://www.revista-apunts.com/. This work is licensed under a Creative Commons Attribution-NonCommercial-NoDerivatives 4.0 International License. The images or other third party material in this article are included in the article’s Creative Commons license, unless indicated otherwise in the credit line; if the material is not included under the Creative Commons license, users will need to obtain permission from the license holder to reproduce the material. To view a copy of this license, visit https://creativecommons.org/licenses/by-nc-nd/4.0/deed.en


