Sex-Related Differences in Physical Determinants of Young High-Performance Tennis Players’ Serve Velocity
Joshua Colomar
Francisco Corbi
Ernest Baiget Vidal
*Corresponding author: Joshua Colomar joshua.colomar@uvic.cat
Cite this article
Colomar, J., Corbi, F. & Baiget, E. (2024). Sex-Related Differences in Physical Determinants of Young High-Performance Tennis Players' Serve Velocity. Apunts Educación Física y Deportes, 157, 58-67. https://doi.org/10.5672/apunts.2014-0983.es.(2024/3).157.07
Abstract
Maximum isometric force-time curve variables are positively related to tennis serve velocity (SV), especially in short time frames and specific movements. This influence could vary depending on gender. For this reason, this study aimed at: a) examining differences between anthropometrics and force-time curve variables in male and female young high-performance tennis players, and b) analyzing associations between these variables and SV. Forty-five players were asked to execute two maximal voluntary isometric contractions (MVIC) in joint positions (shoulder internal rotation [SHIR] and shoulder extension [SHE] at 90 degrees) involved in the serve motion. Results indicated significant greater values for males in SV, SHE peak rate of force development (PRFD), SHIR impulse (IMP) 0 to 150 ms and SHE IMP 0 to 150, 200 and 250 ms. Males presented significant correlations between SV, SHIR and SHE MVIC, PRFD, SHIR RFD at 100, 150, 200, 250 ms and SHE RFD at 50 ms. Females showed positive associations between SV, body mass (BM), SHE MVIC, SHIR RFD at 30, 100 and 150 ms, SHIR IMP at 150, 200 and 250 ms and SHE IMP 150, 200 and 250 ms. Males SV seems to rely on maximal absolute and relative strength values, while females SV may be affected to a superior degree by a combination of greater body mass, maximal levels of force production and accumulation in short time frames.
Introduction
Recent research has established isometric force-time curve variables representing maximum isometric and explosive strength as essential factors that are positively related to serve ball velocity (SV) (Baiget et al., 2021; Colomar et al,, 2022a; Colomar et al., 2022b). These indicators have a strong association with the capacity of hitting the ball faster, especially in specific joint positions involved in the serve kinetic chain. Particularly, the capability of developing maximal strength values (Baiget et al., 2016) and force in short time frames (< 250 ms) in motions such as the shoulder internal rotation (SHIR), shoulder extension (SHE), wrist flexion (WF) or the isometric mid-thigh pull (IMTP) seem of high importance in both competition (Baiget et al., 2021) and young players (Colomar et al., 2022a). Diverse variables can be derived from the force-time curve, but essentially high levels of maximal voluntary isometric contraction (MVIC) in SHIR and SHE motions will positively impact the buildup of force and increase the rotational upper arm acceleration during the swing to impact, improving the subsequent SV (Baiget et al., 2016, 2021; Colomar et al., 2022a; Hayes et al., 2018). Moreover, variables depending on force application over time such as the rate of force development (RFD) or impulse (IMP) have also been established as crucial factors affecting the final SV outcome (Colomar et al., 2022b). Both early (< 100 ms) or late (> 100 ms) phases from the onset muscle contraction time are important to determine the angular velocity achieved by body segments involved in the kinetic chain alongside building a greater momentum and a final high-speed racquet motion (Baiget et al., 2021; Colomar et al., 2022a).
Literature states the importance of explosive force production in both older more experienced players and in young population (Colomar et al., 2022a). Nevertheless, no studies have compared the significance of these variables in male and female participants. Certain differences arise when comparing genders in determinant physical indicators that influence SV (Colomar et al., 2022b). For example, body height (BH) shows large associations with SV in both genders, although stronger ratios in male competitors (r = .48 – 0.64 vs. .48 – .59) are observed (Baiget et al., 2022; Fett et al., 2020; Vaverka & Cernosek, 2013), while in female players body mass (BM) or body mass index (BMI) are more important anthropometric influencing factors (Colomar et al., 2022a; Fernandez-Fernandez et al., 2019; Fett et al., 2020; Wong et al., 2014). In this line, muscle strength, power, and range of motion (RoM) have also shown significantly different values depending on the players age (Fett et al., 2020), maturational status (Fernandez-Fernandez et al., 2021), level (Colomar et al., 2020), or sex (Fernandez-Fernandez et al., 2019). Specifically, regarding sex-related differences, male players seem to rely more thoroughly on physical qualities such as upper body power values (i.e., medicine ball throws) and shoulder isometric strength in specific serve positions, while resultant SV in female participants seems to be more influenced by anthropometric characteristics (i.e., BM and BMI) (Fernandez-Fernandez et al., 2019). Besides, when comparing racquet and ball kinematics, although a big number of variables seem similar between male and female professional players, some aspects such as a lesser shoulder internal rotation executed by females differ between both sexes (Elliott et al., 2013). Also, from a tactical perspective, female players tend to hit more serves to the opponents body, while males are more likely to aim to the corners of the service box (Hizan et al., 2015). These results restate that SV is a multifactorial ability influenced by several characteristics and that they highly vary depending on the individuals analyzed (Colomar et al., 2022b). Following this idea, differences may also exist when analyzing explosive force production variables in specific joint positions involved in the serve action, making for interesting studies in this regard that may offer coaches information on how to approach training programs depending on the addressed population. We hypothesized sex-related differences would exist in RFD, IMP and MVIC, which would result in a significant greater SV in male players.
Thus, the goals of this study were a) to examine the differences between anthropometrics and force-time curve variables in male and female young tennis players, and b) to analyze the strength of the associations between these variables and SV in both genders.
Methodology
Participants
Forty-five (15 female and 30 male, [Table 1]) high-performance junior tennis players (ITN = 2.7 ± 2.1 and 2.9 ± 0.3, respectively) volunteered for the study. Participants had a training volume of 20 h·week-1 comprising 3 h of technical and tactical tennis practice and 1 h of fitness training per day from Monday to Friday. The player’s competitive level (ITN) was established by the consensus of three coaches accredited with the Professional Tennis Register (Registro Profesional de Tenis, RPT) level 3, following the ITN Description of Standards (ITN, 2019). Four participants were left-handed while all others had a right dominant extremity. Inclusion criteria included to have at least 1 year of participation in a structured strength and conditioning program and a minimum of 5 years of tennis training and competition. Exclusion criteria were any back, upper or lower extremity distress or to have undergone rehabilitation or surgery in the past 3 months. All participants and their parents were informed about the particularities of the study and signed an informed consent form. Since the participants were underaged, their legal tutors signed the agreement. The study was conducted following the ethical principles for biomedical research with human beings established in the Declaration of Helsinki of the AMM (2013) and approved by the Ethics Committee of the Catalan Sports Council (15/CEICGC/2020).

Materials and instruments. Procedure
The testing was divided into two sessions performed on the same day and separated by 10 minutes. Participants performed the force-time curve variable testing followed by the SV evaluation. Due to academy schedule organization, participants did not exercise for at least 18 h before the protocol took place. They were indicated to maintain their regular routine, to avoid excitatory substances and vigorous exercise during the previous hours to the testing sessions. All measurements were performed in the morning, approximately from 8:00 am to 9:00 am. The experiments were executed during the competition period of the season.
Force-time characteristics assessment
Participants were asked to execute two upper body MVIC tests of muscle actions in joint positions involved in the forward swing of the service motion. Positions tested were the SHIR with the elbow flexed and the shoulder abducted 90º and the 90º SHE and fully extended elbow. Prior to testing, and as a warm up, participants performed two submaximal attempts of 3 seconds of the selected positions at approximately 50 %-75 % of MVIC, separated by 60 seconds (Comfort et al., 2019). Tests were performed similarly to Baiget et al. (2016) on an Ercolina machine (Technogym Company, Cesena, Italy), participants sat with a 90º hip flexion and their back resting on a bench and fastened with a harness to avoid extra movement of other body sections. Only the dominant extremity was registered. The force-time curve was registered using a strain gauge sampling at 80 Hz (Chronojump, Boscosystem, Barcelona, Spain). MVIC and peak rate of force development (PRFD) were defined as the peak value attained during the 5 seconds. Relative MVIC was calculated by dividing the MVIC result of the 5 seconds by the participants body weight in kilograms. Furthermore, force outputs from 0 to 50, 100, 150, 200 and 250 ms from the start of the pull were determined for each trial to obtain RFD and IMP values (Comfort et al., 2015). RFD was calculated with the equation: RFD = ΔForce / ΔTime. Participants performed two trials spaced by a 2 min-rest between attempts and 5 between positions. Both positions were measured randomly, and the best score was used for analysis. The force-time curve variables assessed showed acceptable levels of reliability (ICC = > 0.753; CV = < 20%), in accordance with previous similar research (Baiget et al., 2021; Colomar et al., 2022a).
Serve ball velocity (SV)
SV was assessed on a tennis clay court under stable wind conditions (< 2 m·s-1) and using new tennis balls (Head ATP Pro, Spain). Before the evaluation, participants performed a warm-up including mobility exercises, 5 minutes of free rallies and 10 progressive serves. Each player executed 8 flat serves against no opponent (4 serves on each side of the court) with 2 minutes of rest between sets and 10 seconds between serves. Only the serves that landed in the serve box were included in the examination. SV was determined using a hand-held radar gun (Stalker ATS II, USA, frequency: 34.7 GHz [Ka-Band] ± 50 MHz), registering ball speed after impact. The radar was positioned 2 m behind the center of the baseline and at a height of 2 m. Players were asked to hit “as hard as possible into the serve box” and direct feedback was given to provide support. Mean peak velocity of the valid serves was used for the analysis. The SV measurement showed good levels of reliability (ICC = 0.787; CV = 4.4%).
Data Analyses
Descriptive data were reported as mean ± standard deviation (SD). Normality of distributions was assessed with the Shapiro-Wilk test (p < .05). Intra-session reproducibility was assessed using a two-way average measure of the intraclass correlation coefficients (ICCs) and the mean coefficient of variation (CV). The differences between male and female group mean values of SV, absolute and relative MVIC, PRFD, RFD, and IMP at different time frames during a SHIR or SHE were tested with an independent samples t-test. Also, absolute percentage change was included as group difference analysis. The magnitude of the differences in mean was quantified as effect size (ES) and interpreted according to the criteria used by Cohen (1988); < 0.2 = trivial, 0.2-0.4 = small, 0.5-0.7 = moderate, > 0.7 = large. Thirty-one preplanned comparisons were considered in this study. Accordingly, correction for multiple comparisons was performed using the Holm-Bonferroni method (Holm, 1979). In addition, Pearson correlation coefficient was used to examine the relations between SV, absolute and relative MVIC, PRFD, RFD, and IMP at different contraction times in the SHIR and SHE positions in male and female players. Correlations were classified as trivial (0-.1), small (.1-.3), moderate (.3-.5), large (.5-.7), very large (.7-.9), nearly perfect (.9), and perfect (1) (Hopkins et al., 2009). Following this analysis, we also calculated the coefficient of determination to further assess the explanatory power of the relationships observed. The level of significance was set at p < .05. All statistical analyses were performed using JASP (JASP 0.16.1, University of Amsterdam, Netherlands).
Results
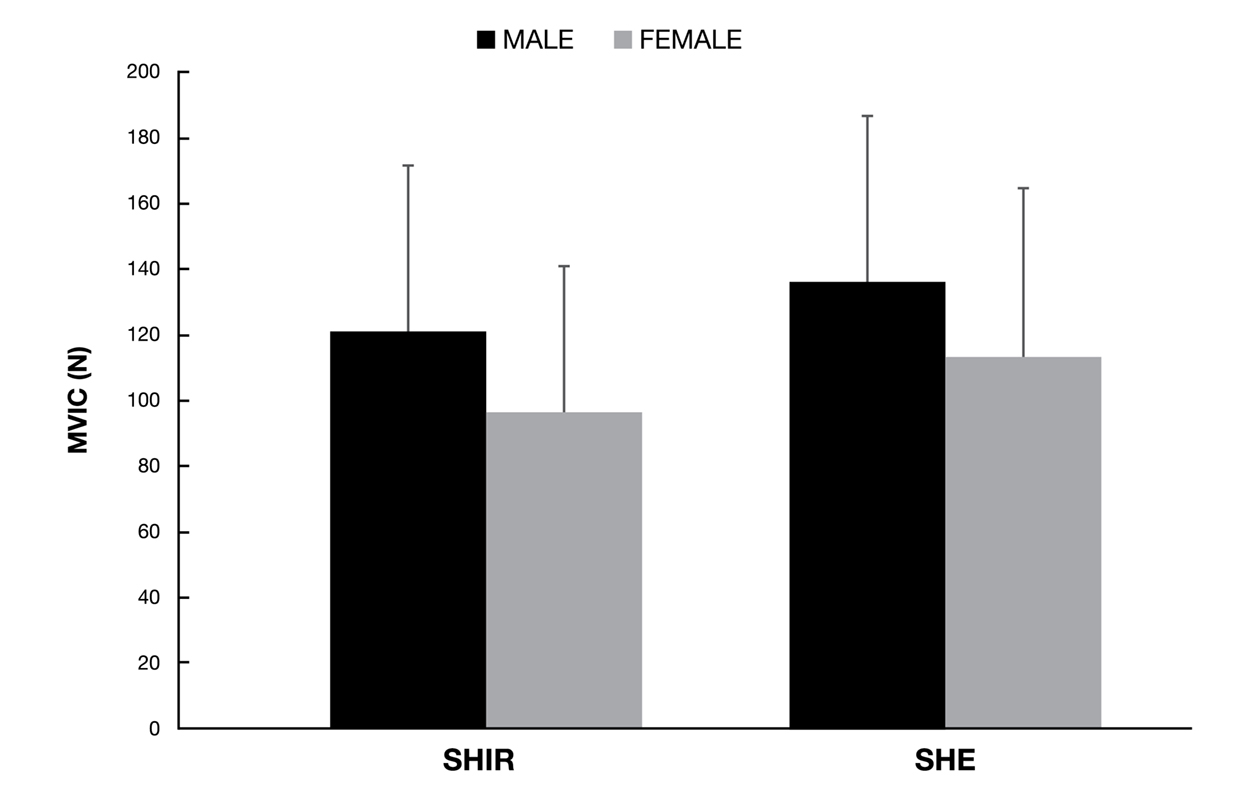
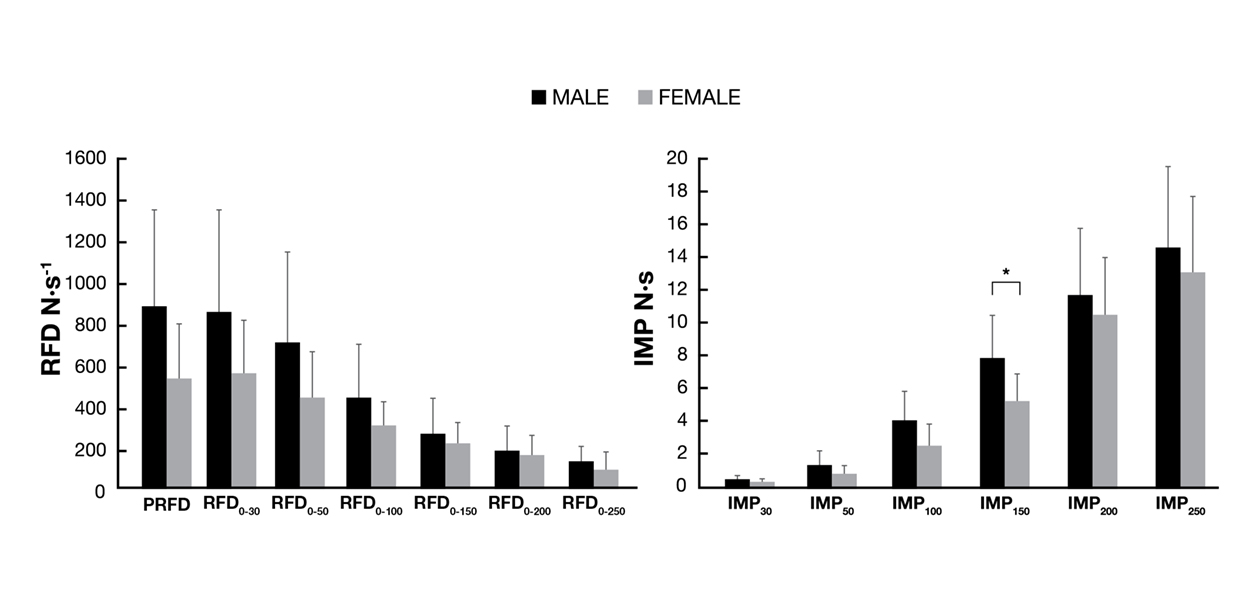
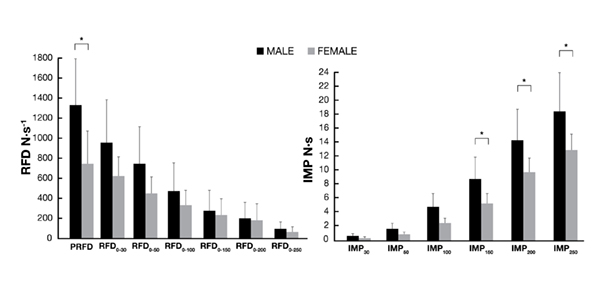
Males SV analysis resulted in a mean value of 144.2 ± 8.4 km·h-1, while female participants had a mean score of 124.9 ± 12.6 km·h-1. Large SV differences (mean: 19.3 km·h-1; p = .031, ES = 1.9, percentage change = 15.5 %) were found between boys and girls. Force-time curve variable sex-related differences are expressed in Table 2 and plotted in Figures 1 (SHIR and SHE MVIC), 2 (SHIR RFD and IMP) and 3 (SHE RFD and IMP). Significant differences favoring male participants were found in SHE PRFD, SHIR IMP from 0 to 150 and SHE IMP from 0 to 150, 0 to 200, and 0 to 250 ms.
Table 2
Male (n = 30) and female (n = 15) serve ball speed and joint-specific force-time curve differences.
* = p < .05.
Correlation coefficients between SV and isometric force-time variables of male and female participants are summed up in Table 3. In male participants, significant moderate-to-large correlations were found between SV, absolute and relative SHIR MVIC and SHE MVIC, SHIR and SHE PRFD, SHIR RFD from 0 to 100, 0 to 150, 0 to 200, 0 to 250 ms, and SHE RFD from 0 to 50 ms. Regarding female players, significant moderate-to-large positive correlations were found between SV, BM, absolute and relative SHE MVIC, SHIR RFD from 0 to 30, 0 to 100, and 0 to 150 ms, SHIR IMP at 150, 200 and 250 msand SHE IMP at 150, 200 and 250 ms.
Table 3
Male (n = 30) and female (n = 15) correlations between serve ball speed and anthropometric and specific-joint force-time curve variables.
Discussion
The main finding of this research was that SV sex-related differences existed between these competitors, probably due to higher values achieved by male players in key isometric force-time curve variables that influence the final speed of the serve (i.e., SHE PRFD and IMP). Also, the strength of the correlations between SV and the tested variables indicate that young male players may rely more thoroughly on maximal absolute and relative strength values (MVIC, RMVIC, and PRFD), while in female the competitor’s SV seems to be affected to a greater extent by a combination of anthropometric characteristics (BM), maximal strength values (SHE MVIC), and force accumulation over time (IMP).
SV is highly influenced by strength values derived from the force-time curve while performing joint-specific actions present in the serve kinetic chain (Baiget et al., 2016, 2021; Colomar et al., 2022a). To our knowledge, results in this research are the first to examine differences regarding these variables in young male and female high-performance tennis players. Outcomes of the analysis show that male players express greater scores in SHE peak values of explosive strength (PRFD), explosiveness (RFD) in what are considered early phases from the onset muscle contraction time (i.e., 150 ms) (Andersen et al., 2010), and SHE force accumulation over time (IMP) from 0 to 150, 200, and 250 ms. The serve is a highly dynamic action executed at high speeds in very short time frames. Although the total motion can last around 650 ms, the available time to produce force during the concentric muscle activation phase can be as short as 80 ms (Kibler et al., 2007). Therefore, it seems reasonable that the fact that males are capable of producing greater values in some variables such as PRFD, RFD, and IMP, especially in early contraction times, implies a higher capacity to increase arm acceleration in the swing to impact and angular momentum of the head of the racquet that will positively influence SV (Baiget et al., 2021). On the other hand, RFD, absolute and relative MVIC did not show significant sex-related differences. Early phases of contraction seem to be more determined by neural aspects such as motor unit discharge rate and intrinsic muscle properties, while overall maximal strength may be more important in the later time frames (Andersen et al., 2010; Andersen & Aagaard, 2006). This would explain how RFD values did not show statistically significant differences in any movement or time window, as maximal values of SHIR and SHE MVIC did not express dissimilarities between male and female participants. Nevertheless, non-significant results regarding MVIC are surprising, as literature has recurrently found sex-related differences in this variable (Cools et al., 2014; Fernandez-Fernandez et al., 2019; Johansson et al., 2022). Although non-significant, greater scores, moderate effect sizes and percentual changes of around 20% can be observed in favor of male participants. This may indicate that boys of this particular age and level show rather similar MVICs as their female peers, as their strength values are still increasing throughout adolescence (Johansson et al., 2022). In fact, results show even lower differences in RMVIC, which are in accordance with previous literature indicating that differences in overhead athletes’ strength values may disappear when normalized to BM (Cools et al., 2016; Harbo et al., 2012). Another interesting aspect is that the maximum isometric force levels obtained in this study are specific to the angle analyzed (Oranchuk et al., 2019). This suggests that the observed correlation levels could vary depending on the joint angle analyzed. Therefore, the results of this study should not be extrapolated to other angles or positions.
Regarding the strength of the correlations between SV, anthropometric and force-time curve variables, male participants showed significant associations with all maximal strength values (i.e., SHIR and SHE absolute and relative MVIC and PRFD) and in SHIR RFD in contraction times over 100 ms, but not with the rest of RFD measurements or IMP. On the other hand, girls showed significant results in a reduced number of maximal strength variables (i.e., SHE MVIC and RMVIC), but most importantly with BM and measures of explosive strength such as SHIR RFD from 0 to 30, 100 and 150 msalongside SHIR IMP at 150, 200, 250 msand SHE IMP at 150, 200 and 250 ms. In accordance with previous research, male participants seem to rely thoroughly on maximal isometric values of strength in specific joint positions of the serve kinetic chain (Baiget et al., 2016, 2021; Fernandez-Fernandez et al., 2019). These associations seem stronger than values of explosiveness and accumulation of force throughout time that, although previously deemed important in young competitors (Colomar et al., 2022a), only showed significant correlations in SHIR RFD over 100 mstime frames in this sample of players. Regarding females, positive associations were found across variables that express maximal strength, but also BM, force output and accumulation with respect of contraction time. This is in line with the general idea that the tennis serve is a multifactorial action that requires multiple capacities to produce high speeds (Colomar et al., 2022b). Contrary to males, which seem to take advantage of enhanced maximal strength values, the existence of significant correlations between BM, MVIC, RFD and IMP in female players may indicate that velocity production of girls relies more thoroughly on the combination of several aspects rather than on one predominant strength indicator. Although verifying this idea was not the aim of this study, if it is confirmed in future research, this would indicate the need to guide service speed training differently depending on gender. Interestingly, IMP was strongly associated with SV, indicating also that the ability to build up energy over time and transfer it throughout the kinetic chain in a coordinated manner seems important for female participants. Alongside this, BM seems to have a strong influence on SV, as found in previous literature (Baiget et al., 2021; Fernandez-Fernandez et al., 2019; Fett et al., 2020). The increase in BM in girls that typically occurs when reaching adolescence (Malina et al., 2015) can increase torque production and have a positive influence on SV. Nevertheless, an adequate development of lean BM is encouraged, since an increase in this aspect should not highjack improvements in explosive strength variables that are key for velocity production (Colomar et al., 2022b).
Last, and as a limitation of this study, biomechanical proficiency has a great influence on SV, especially at young ages and during growth (Colomar et al., 2022a). Alongside certain anthropometric and strength variables tested here, kinematics most likely would explain how segment’s force-generating capacity is managed as a function of time and space to generate maximum SV, since the same serve speed can be achieved with different joint implications. Nevertheless, these aspects were not tested here, and their inclusion together with range of motion capacities (Fernandez-Fernandez et al., 2019) would be of great interest to examine the full spectrum of physical abilities that influence velocity production and the differences between genders. Also, the sampling rate of the strain gauge may have been relatively low for initial stages of contraction (< 100 ms), affecting results to some extent. Finally, different types of serves (topspin or slice) could influence the relevance and importance of the different variables tested, which makes it important to address these issues in further studies.
Conclusion
Male and female young tennis players of the same age, level and training characteristics that participated in this study showed significant differences in certain key isometric maximal and explosive strength variables that highly influence velocity production in the serve. Because of this, male competitors show greater values in a functional key parameter that affects performance such as SV. Correlations between SV and force-time curve variables indicate that, in order to guarantee velocity production, adolescent boys mainly rely on maximal absolute and relative strength values (MVIC, RMVIC, and PRFD) over explosiveness and accumulations of force over time. On the other hand, female competitors SV may be affected to a superior degree by a combination of diverse physical abilities, including anthropometric characteristics (BM), maximal levels of strength (SHE MVIC and RMVIC) and expressions of force production and accumulation in short time frames (i.e., RFD and IMP). In accordance with these results, when planning a SV improvement program, certain differences in training approaches between sexes may be important. On the one hand, when intending to improve the MVIC or PRFD in positions involved in the tennis serve kinetic chain, coaches are encouraged to use resistance training programs such as isometric interventions, as they have been established as a valid option to improve these qualities in short periods of time (Baiget et al., 2023). On the other hand, when intending to improve force production and IMP in short time frames, interventions that include fast rotations, specific movements from the kinetic chain and are performed with light to moderate weights seem the best option (Baiget et al., 2021).
Acknowledgements
The authors would like to thank the coaches and players for their enthusiastic participation.
References
[1] Andersen, L. L., & Aagaard, P. (2006). Influence of maximal muscle strength and intrinsic muscle contractile properties on contractile rate of force development. European Journal of Applied Physiology, 96, 46-52. doi.org/10.1007/s00421-005-0070-z
[2] Andersen, L. L., Andersen, J. L., Zebis, M. K., & Aagaard, P. (2010). Early and late rate of force development: Differential adaptive responses to resistance training? Scandinavian Journal of Medicine & Science in Sports, 20(1), e162-e169. doi.org/10.1111/j.1600-0838.2009.00933.x
[3] Baiget, E., Colomar, J., & Corbi, F. (2021). Upper-Limb Force-Time Characteristics Determine Serve Velocity in Competition Tennis Players. International Journal of Sports Physiology and Performance, 17(3), 358-366. doi.org/10.1123/ijspp.2021-0254
[4] Baiget, E., Colomar, J., & Corbi, F. (2023). Six-Week Joint-Specific Isometric Strength Training Improves Serve Velocity in Young Tennis Players. International Journal of Sports Physiology and Performance, 18(2), 148-156. doi.org/10.1123/ijspp.2022-0292
[5] Baiget, E., Corbi, F., Fuentes, J. P., & Fernández-Fernández, J. (2016). The Relationship Between Maximum Isometric Strength and Ball Velocity in the Tennis Serve. Journal of Human Kinetics, 53(1), 63-71. doi.org/10.1515/hukin-2016-0028
[6] Baiget, E., Corbi Soler, F., & López, J. (2022). Influence of anthropometric, ball impact and landing location parameters on serve velocity in elite tennis competition. Biology of Sport. 40(1), 273-281. doi.org/10.5114/biolsport.2023.112095
[7] Colomar, J., Baiget, E., & Corbi, F. (2020). Influence of Strength, Power, and Muscular Stiffness on Stroke Velocity in Junior Tennis Players. Frontiers in Physiology, 11. doi.org/10.3389/fphys.2020.00196
[8] Colomar, J., Corbi, F., & Baiget, E. (2022a). Relationship between isometric force-time curve variables and serve velocity in young tennis players. Sports Biomechanics, 1-13. doi.org/10.1080/14763141.2022.2084151
[9] Colomar, J., Corbi, F., Brich, Q., & Baiget, E. (2022b). Determinant Physical Factors of Tennis Serve Velocity: A Brief Review. International Journal of Sports Physiology and Performance, 17(8), 1159-1169. doi.org/10.1123/ijspp.2022-0091
[10] Comfort, P., Dos’Santos, T., Beckham, G. K., Stone, M. H., Guppy, S. N., & Haff, G. G. (2019). Standardization and Methodological Considerations for the Isometric Midthigh Pull. Strength and Conditioning Journal, 41(2), 57-79. doi.org/10.1519/SSC.0000000000000433
[11] Comfort, P., Jones, Paul. A., McMahon, J. J., & Newton, R. (2015). Effect of Knee and Trunk Angle on Kinetic Variables During the Isometric Midthigh Pull. Test–Retest Reliability. International Journal of Sports Physiology and Performance, 10(1), 58-63. doi.org/10.1123/ijspp.2014-0077
[12] Cools, A. M. J., Vanderstukken, F., Vereecken, F., Duprez, M., Heyman, K., Goethals, N., & Johansson, F. (2016). Eccentric and isometric shoulder rotator cuff strength testing using a hand-held dynamometer: Reference values for overhead athletes. Knee Surgery, Sports Traumatology, Arthroscopy, 24, 3838-3847. doi.org/10.1007/s00167-015-3755-9
[13] Cools, A. M., Palmans, T., & Johansson, F. R. (2014). Age-Related, Sport-Specific Adaptions of the Shoulder Girdle in Elite Adolescent Tennis Players. Journal of Athletic Training, 49(5), 647-653. doi.org/10.4085/1062-6050-49.3.02
[14] Elliott, B., Whiteside, D., Lay, B., & Reid, M. (2013). The female tennis serve: an analagous version of the male serve? Conference: 31st Conference of 31st International Society of Biomechanics in Sport.
[15] Fernandez-Fernandez, J., Canós-Portalés, J., Martinez-Gallego, R., Corbi, F., & Baiget, E. (2021). Effects of Maturation on Lower-Body Neuromuscular Performance in Youth Tennis Players. Journal of Strength and Conditioning Research, 37(1), 167-173. doi.org/10.1519/JSC.0000000000004187
[16] Fernandez-Fernandez, J., Nakamura, F. Y., Moreno-Perez, V., Lopez-Valenciano, A., Del Coso, J., Gallo-Salazar, C., Barbado, D., Ruiz-Perez, I., & Sanz-Rivas, D. (2019). Age and sex-related upper body performance differences in competitive young tennis players. PLOS ONE, 14(9), e0221761. doi.org/10.1371/journal.pone.0221761
[17] Fett, J., Ulbricht, A., & Ferrauti, A. (2020). Impact of Physical Performance and Anthropometric Characteristics on Serve Velocity in Elite Junior Tennis Players. Journal of Strength and Conditioning Research, 34(1), 192-202. doi.org/10.1519/JSC.0000000000002641
[18] Harbo, T., Brincks, J., & Andersen, H. (2012). Maximal isokinetic and isometric muscle strength of major muscle groups related to age, body mass, height, and sex in 178 healthy subjects. European Journal of Applied Physiology, 112, 267-275. doi.org/10.1007/s00421-011-1975-3
[19] Hayes, M. J., Spits, D. R., Watts, D. G., & Kelly, V. G. (2018). The Relationship Between Tennis Serve Velocity and Select Performance Measures. Journal of Strength and Conditioning Research, 35(1), 190-197. doi.org/10.1519/JSC.0000000000002440
[20] Hizan, H., Whipp, P., & Reid, M. (2015). Gender Differences in the Spatial Distributions of the Tennis Serve. International Journal of Sports Science & Coaching, 10(1), 87-96. doi.org/10.1260/1747-9541.10.1.87
[21] Holm, S. (1979). A Simple Sequentially Rejective Multiple Test Procedure. Scandinavian Journal of Statistics, 6(2), 65-70. www.jstor.org/stable/4615733
[22] Hopkins, W. G., Marshall, S. W., Batterham, A. M., & Hanin, J. (2009). Progressive Statistics for Studies in Sports Medicine and Exercise Science. Medicine & Science in Sports & Exercise, 41(1), 3-12. doi.org/10.1249/MSS.0b013e31818cb278
[23] ITN (2019). International Tennis Federation Description of Standards. Available from: www.thaitennisfriendship.net/itn-chart.html (accessed June 10, 2024).
[24] Johansson, F., Asker, M., Malmberg, A., Fernández-Fernández, J., Warnqvist, A., & Cools, A. (2022). Eccentric and Isometric Shoulder Rotation Strength and Range of Motion: Normative Values for Adolescent Competitive Tennis Players. Frontiers in Sports and Active Living, 4. doi.org/10.3389/fspor.2022.798255
[25] Kibler, W. B., Chandler, T. J., Shapiro, R., & Conuel, M. (2007). Muscle activation in coupled scapulohumeral motions in the high performance tennis serve. British Journal of Sports Medicine, 41(11), 745-749. doi.org/10.1136/bjsm.2007.037333
[26] Malina, R. M., Rogol, A. D., Cumming, S. P., Coelho e Silva, M. J., & Figueiredo, A. J. (2015). Biological maturation of youth athletes: Assessment and implications. British Journal of Sports Medicine, 49(13), 852-859. doi.org/10.1136/bjsports-2015-094623
[27] Oranchuk, D. J., Storey, A. G., Nelson, A. R., & Cronin, J. B. (2019). Isometric training and long-term adaptations: Effects of muscle length, intensity, and intent: A systematic review. Scandinavian Journal of Medicine & Science in Sports, 29(4), 484-503. doi.org/10.1111/sms.13375
[28] Vaverka, F., & Cernosek, M. (2013). Association between body height and serve speed in elite tennis players. Sports Biomechanics, 12(1), 30-37. doi.org/10.1080/14763141.2012.670664
[29] Wong, F. K., Keung, J. H., Lau, N. M., Ng, D. K., Chung, J. W., & Chow, D. H. (2014). Effects of Body Mass Index and Full Body Kinematics on Tennis Serve Speed. Journal of Human Kinetics, 40(1), 21-28. https://doi.org/10.2478/hukin-2014-0003
ISSN: 2014-0983
Received: November 27, 2023
Accepted: January 29, 2024
Published: July 1, 2024
Editor: © Generalitat de Catalunya Departament de la Presidència Institut Nacional d’Educació Física de Catalunya (INEFC)
© Copyright Generalitat de Catalunya (INEFC). This article is available from url https://www.revista-apunts.com/. This work is licensed under a Creative Commons Attribution-NonCommercial-NoDerivatives 4.0 International License. The images or other third party material in this article are included in the article’s Creative Commons license, unless indicated otherwise in the credit line; if the material is not included under the Creative Commons license, users will need to obtain permission from the license holder to reproduce the material. To view a copy of this license, visit https://creativecommons.org/licenses/by-nc-nd/4.0/deed.en


