Lifeguard’s Swimming: Front-crawl’s and Up-head Front Crawl’s Energetics
Luis da Fontoura Iglesias
Wellington G. Feitosa
Ricardo de A. Correia
Lucas Beal
Laura Menin
Flávio A. de S. Castro
Cássia Daniele Zaleski Trindade
*Corresponding author: Wellington G. Feitosa wellington.feitosa@uece.br
Cite this article
Iglesias, L.F., Feitosa, W.G., Zaleski Trindade, C.D., Correia, R.A., Beal, L., Menin, L. & Castro F.A.S., (2021). Lifeguard’s Swimming: Front-crawl’s and Up-head Front Crawl’s Energetics. Apunts Educación Física y Deportes, 146, 78-85. https://doi.org/10.5672/apunts.2014-0983.es.(2021/4).146.09
Abstract
Lifeguards use, as part of aquatic rescue, the front crawl and up-head front crawl. Studies on energy expenditure and complementary physiological variables obtained during aquatic rescue strategies are rare. The aim of this study was to compare the front-crawl’s and up-head front crawl’s energetics and performance as carried out by lifeguards. Twenty-one military lifeguards voluntarily participated in this study. Two tests were performed at maximum intensity: 100-meters in both front crawl and up-head front crawl. From each test, physiological data (direct measurement of oxygen uptake, lactacidemia, and heart rate), rate of perceived exertion, and mean swimming speed (two-dimensional video-analysis) were identified. Each energetic source contribution and energy cost were calculated. Descriptive and inferential statistics were used for α < .05. The performance was better in the front-crawl, the physiological results were similar between front-crawl and up-head front crawl, and higher energy cost in up-head front crawl (1.90 ± 0.33 kJ∙m-1) compared to the front-crawl (1.51 ± 0.33 kJ∙m-1). In conclusion, the up-head front crawl is less economical when compared to the front-crawl.
Introduction
Aquatic rescue by lifeguards is part of the strategies to reduce the number of deaths (Gámez de la Hoz & Padilla Fortes, 2017; Szpilman et al., 2016; Wallis et al., 2015). The possibility of successful rescue increases in regulated swimming environments, such as swimming pools and open water with trained lifeguards (Chan et al., 2018; Idris et al., 2017; Jeong et al., 2016). Swimming is the most common form of rescue to reach and remove the victim from the water. Lifeguards carry out the front crawl stroke (FC) with the head in the water as the fastest and more economical way of human locomotion in water (Barbosa, Fernandes, et al., 2006). However, the rescuer’s first option is the up-head front crawl (UH), which consists of the front crawl with the head above water and facing forward to allow a constant visualization of someone at possible risk of drowning.
FC and UH as forms of locomotion in the aquatic environment seem to require different energy costs and total metabolic energy expenditures, depending on swimming speed and drag due to body position (Barbosa, Lima, et al., 2006; Figueiredo et al., 2013; Gonjo et al., 2018; Zamparo et al., 1996). Physiological and biomechanical parameters can provide useful information for lifeguard training, but such studies are very scarce in the literature.
In swimming, the more the body is horizontal in relation to the water surface, the lower the drag and the better the performance (Zamparo et al., 2009). The main technical difference between FC and UH is the head-up position. Head elevation causes the hips and legs to sink, increasing the body’s contact area with the water due to an increase of the angle formed between hip and shoulder in relation to the water surface, consequently increasing drag (Toussaint & Hollander, 1994; Zamparo et al., 2009). Both drag and swimming speed influence energy cost in the aquatic environment (Pendergast et al., 2006; Toussaint & Hollander, 1994). Energy cost can be expressed as the quotient between total metabolic energy expenditure (sum of energies from the three energy pathways of aerobic, anaerobic alactic and lactic) and the mean swimming speed at a given distance (Figueiredo et al., 2012). For the same swimming speed, the FC presents the lowest energy cost compared to other swimming strokes (Pendergast et al., 2015).
Studies that seek to analyze and support the activity of lifeguard training are of extreme relevance, although scarce. In this way, with studies focusing the UH energetic and energy cost, training could be more specific. The main outcome ought is a reduction in death rates by drowning and a better clinical condition of saved victims, reducing the possible physiological and psychological sequelae (Schwebel et al., 2007; Wallis et al., 2015). Studies on the performance of lifeguards can inform society work, helping to improve lifeguard fitness (the better prepared lifeguards are, the greater the chance of work success). By analyzing in depth the swimming techniques used by lifeguards, we hope to obtain a body of knowledge that will serve to improve the training and orientation processes at the time of rescue. Thus, the objective of this study was to compare the FC and UH energetics and performance carried out by lifeguards. We hypothesized that: (a) performance (swimming speed and test duration) will be better in FC than in UH; (b) oxygen uptake, heart rate, blood lactate concentration and rate of perceived exertion will be higher in UH than in FC; and (c) total metabolic energy expenditures and energy cost will be higher in UH than in FC.
Methods
Participants
Twenty-one trained military lifeguards, all male with at least three years of rescue experience (age: 32.4 ± 3.1 years; body mass 79.2 ± 8.0 kg; height: 177.0 ± 7.2 cm; upper arm span: 183.3 ± 8.1 cm), participated in this study. This study was approved (nº 2.316.201) by the research ethics committee of the Federal University of Rio Grande do Sul, respecting the guidelines of the Helsinki Declaration. All participants gave written consent to participate in the research. Participants were asked to abstain from intense physical effort and/or training for 24 hours before each test.
Design/Experimental procedure
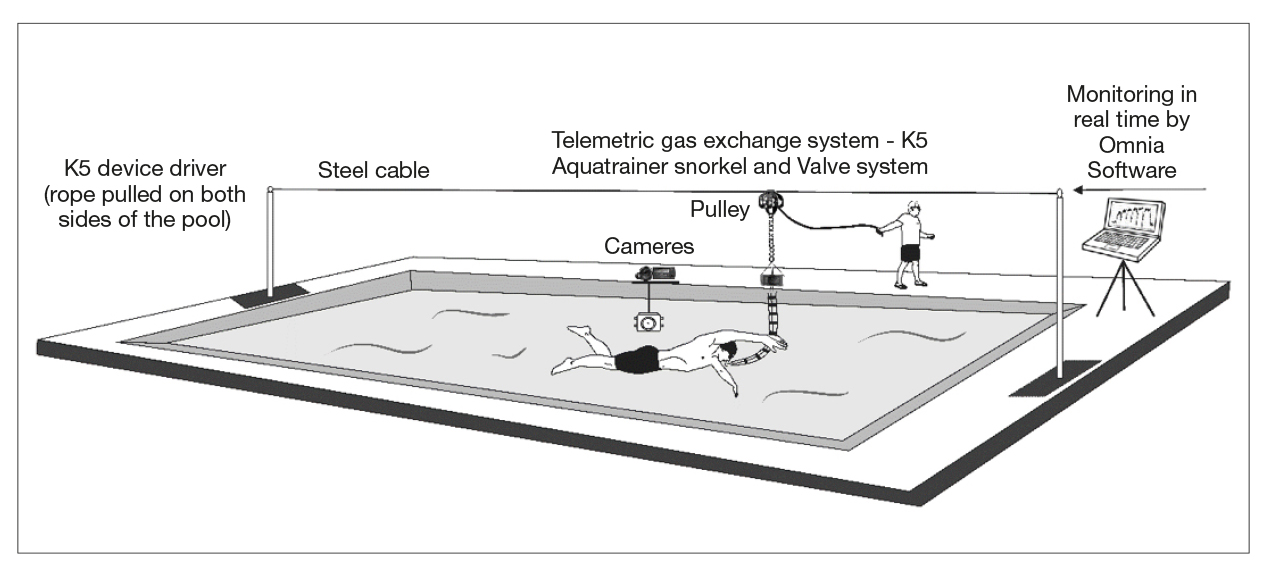
Each participant performed two test sessions in a 25-meter indoor pool (1.90 m deep, water temperature at ≈ 28 ºC). Participants warmed up with a 400-meter FC but with open turns, followed by a 100-meter FC with a regular snorkel. The warm-up was used to make the participants feel even more comfortable with the AquaTrainer® snorkel (Cosmed, Italy) equipment and the pool during the tests. The tests were (i) 100-meter FC and (ii) 100-meter up-UH, performed 24 hours apart and in maximal intensity, with an in-water start and open turns. All lifeguards were previously familiarized with the use of the AquaTrainer® snorkel for six sessions. The setup of the data collection is pictured in Figure 1.
Data collection
Before the swimming test, body mass (SECA® 813 digital scale, resolution of 0.1 kg, Germany), height (SANNY stadiometer, Personal Caprice, resolution of 0.1 cm, Brazil), and arm span (SANNY stadiometer, Personal Caprice, resolution of 0.1 cm, Brazil) were measured. The lifeguards received circular markers (black paste dermatologically tested) on the (bi-laterally) lateral malleolus, greater trochanter of the femur, and acromial process.
Performance in each test was timed by two researchers (CR20 chronometers, Kikos, Brazil). The mean swimming speed (m·s-1) was measured by viogrammetry with support for the Ariel Performance Analysis System (APAS®, Ariel Dynamics Inc., USA) from two sections: 25-50 and 75-100 m (two stroke cycles in each section). The mean swimming speed was obtained by the quotient between hip displacement and time over a complete stroke cycle. A stroke cycle comprised the entry and re-entry of the same hand into the water (Barbosa et al., 2008).
The images for swimming speed identification were recorded with the support of two fixed cameras (Sony Hdr cx260, 60 Hz, United States) one positioned 0.3 m below the water surface line inside a waterproof case (Sony SPK-HCH, United States), and another 0.3 m out of the water (Figure 1). The cameras were halfway through the pool and 7.5 m away from the participant’s sagittal plane of displacement. A device with light-emitting diodes arranged above and below the water was used to synchronize the camera images taken, in accordance with studies by De Jesus et al., 2015. The images were recorded by the cameras within a previously calibrated space (calibration structure with x = 4.5 m [horizontal axis]; y = 1 m [medial-lateral axis]; and z = 1.5 m [vertical axis] dimensions). The root mean square error for the x, y, and z-axes were, respectively, 1.92, 0.29, and 1.34 mm (10 real and 10 control points for underwater and external cameras).
Oxygen uptake (VO2) in both tests was directly measured breath-by-breath using a telemetric portable gas analyzer (K5, Cosmed, Italy) connected to a snorkel and valve system (AquaTrainer®, Cosmed, Italy), suspended at ≈ 2 m over the water surface in a steel cable. The telemetric portable gas analyzer was calibrated before each testing session using reference gases (16% O2 and 5% CO2), and the turbine volume transducer was calibrated with a 3 l syringe. For data treatment, errant breaths (swallowing, coughing, and/or signal interruptions) were withdrawn from the VO2 analysis by only including those within mean ± 4 SD (Ozyener et al., 2001). The data was then smoothed using a 5-breath moving window (De Jesus et al., 2014). Peak oxygen uptake (VO2peak) was considered as the highest value of the curve of both tests (Laffite et al., 2004). VO2 and lactate concentration in rest (respectively, VO2rest and Larest) were measured prior to each test, after 10 minutes in rest. After rest, VO2rest was the mean of VO2 in which the respiratory exchange ratio stabilized at approximately 0.8.
Blood was sampled from the fingertip to determine lactate concentration. It was measured at rest and after exercise (1, 3, 5, and 7 minutes after the test) to identify the peak lactate value (Lapeak). Blood lactate was identified by means of a portable lactometer (Accutrend, Roche, Germany).
Both heart rate (HR) and rate of perceived exertion (RPE) were identified at rest and immediately after each test. To verify the HR, a transmitter was allocated in the xiphoid appendix region of the participants during the tests (Garmin, 920XT, USA). The 15 points Borg-scale (6 – 20) was presented to the participants who indicated the RPE according to their visualization (Borg, 1998).
Energetic Contribution and Cost
The proportions of aerobic and anaerobic metabolism during each test (Equation 1) were calculated by the total energy expenditure equation (Capelli et al., 1998; Di Prampero, 1986; Figueiredo et al., 2011):
Etot = VO2 + βLab + PCr(1 – e-t/r ) (1)
where Etot is the total energy consumption over the test; VO2 was calculated from the time-integral of the net value between VO2peak and VO2rest as the aerobic contribution (Aer, kJ); βLab is the difference between Lapeak and Larest multiplied by 2.7 ml·O2·mM-1 kg-1 and then by the total body mass (kg) as the lactic anaerobic contribution (AnLa, kJ); and PCr (phosphocreatine) is the alactic anaerobic contribution (AnAla, kJ), whereas this energy source corresponds in time constant to 23.4 s (Binzoni et al., 1992). The AnAla was estimated by the concentration of phosphocreatine decreased by 18.55 mM·kg-1 (net weight at maximum activation muscle, assuming 50% of muscle mass activated) (Capelli et al., 1998; Zamparo et al., 2011). Aer and AnLa were expressed in kJ assuming an energetic equivalent of 20.9 kJ lO2-1 and as a % of the total metabolic energy expenditure. Lastly, energy cost (Equation 2) was calculated by the ratio between the total metabolic energy expenditure and mean swimming speed (Di Prampero, 1986):
C = Etot × v-1 (2)
where C is energy cost; Etot is the total energy consumption over the test; and v is swimming speed.
Statistical Analyzes
The G*Power 3.1 software (Düsseldorf, Germany) was used to determine the minimum sample size required (statistical power of .80, α = .05 for the analysis, 95% confidence interval, 5% sampling error, and an assumed effect size of 0.50). All data were checked for distribution normality with the Shapiro-Wilk test. The data were described as the mean ± standard deviation (SD) and 95% confidence interval of the mean [CI]. Comparisons were performed with dependent samples t-test followed by effect size calculation (Rosenthal, 1996):
(when d: 0 < insignificant effect size < 0.19; small effect 0.20 ≤ d ≤ 0.49; medium effect size 0.50 ≤ d ≤ 0.79; large effect size 0.80 ≤ d ≤ 1.29; and very large effect size d ≥ 1.30). Significance level was established at 5%.
Results
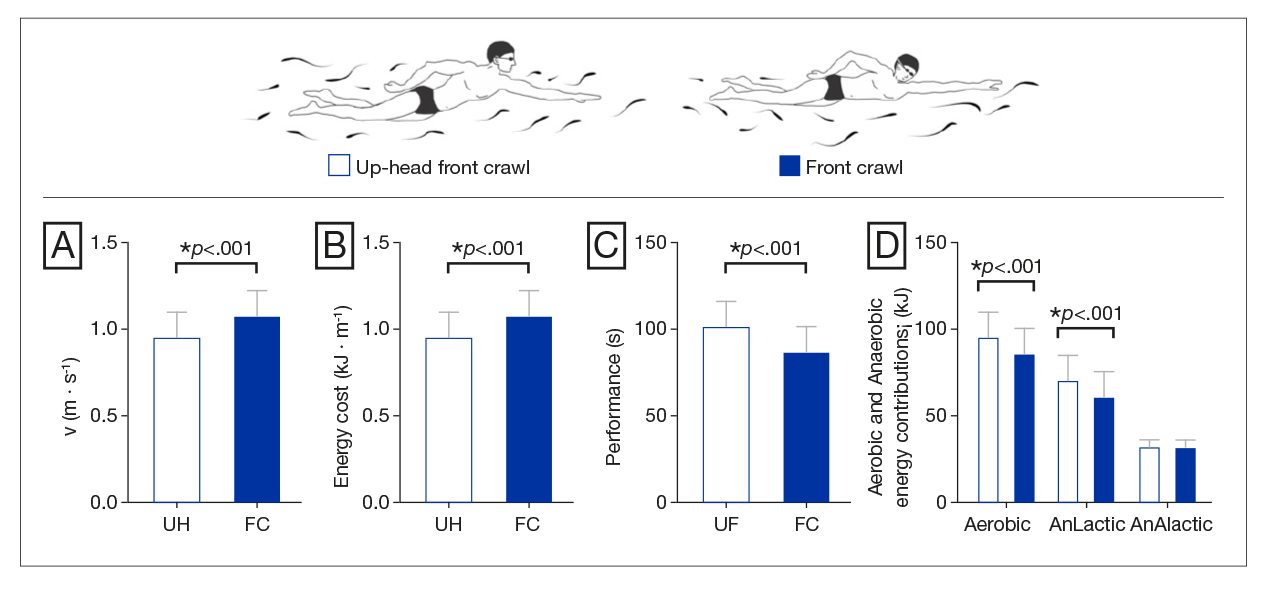
The results were expressed as the mean, SD, CI, and Cohen’s d for the mean of lifeguards for performance and swimming speed, physiological parameters (VO2peak, Lapeak, HR and RPE), total metabolic energy contribution, and energy cost (Table 1). The effect size was very large (d > 1.30) for performance (83.2 ± 8.2 s in FC and 100.5 ± 11.8 s for UH) and large (0.80 ≤ d ≤ 1.29) for swimming speed (1.09 ± 0.13 m∙s-1 in FC and 0.96 ± 0.17 m∙s-1 for UH) (Table 1). The effect size was medium (0.50 ≤ d ≤ 0.79) for Aer (880.2 ± 15.6 kJ in FC and 89.4 ± 18.0 kJ in UH) and small (0.20 ≤ d ≤ 0.49) for AnaerLa (53.4 ± 15.5 kJ in FC and 60.0 ± 15.2 kJ in UH) (Table 1). The effect size was large (0.80 ≤ d ≤ 1.29) for total metabolic energy expenditure (166.4 ± 16.5 kJ in FC and 182.5 ± 23.1 kJ in UH) and very large (d > 1.30) for energy cost (1.51 ± 0.24 kJ∙m-1 in FC and 1.90 ± 0.33 kJ∙m-1 in UH) (Table 1). At rest, no differences were identified for VO2, LA, HR and RPE for FC and UP, respectively: 6.6 ± 1.4 and 6.8 ± 2.3 ml∙kg∙min-1; 2.3 ± 0.8 and 2.0 ± 0.7 mmol∙l-1; 73.5 ± 13.6 and 75.9 ± 14.0 bpm; and 7.3 ± 1.5 and 7.5 ± 1.9 points.
The mean and standard deviation of swim speed (image A) energy cost (image B), performance (image C), and aerobic and anaerobic energy contribution (image D) of lifeguards over the 100-meter up-head front crawl and 100-meter front crawl tests, N = 21, are shown in Figure 2. The results of the FC test were better than the results obtained in the UH test on variable performance (shorter duration in seconds in the 100-meter test) and swimming speed (Figure 2). The aerobic and anaerobic energy contributions were higher in the UH than in the FC (Figure 2). Total metabolic energy expenditure and energy cost were also higher in the UH than in the FC (Table 1, Figure 1).

Table 1
Overall mean, standard deviation, confidence interval, and Cohen’s d for the performance and SS, physiological parameters, the total metabolic energy contribution, and the energy cost for the lifeguards, N = 21.
Discussion
This study assessed and compared performance, oxygen uptake, and complementary physiological variables (peak lactate, heart rate), rate of perceived exertion, total metabolic energy contribution, and energy cost of the FC and the UH carried out by lifeguards. In general, performance was better in the FC than UH. The VO2 and complementary physiological variables (Lapeak, HR) and RPE were not different between FC and UH. The total metabolic energy expenditure and the energy cost were higher in UH than in HR.
Lifeguards can benefit from FC compared to UH due to higher swimming speed and, consequently, have better performance (shorter test duration in seconds). Water rescues demand a sustained visual contact with the victim by the lifeguard (Vignac et al., 2017) and therefore choose to swim in UH first. Rescue in swimming pools or in open water that allows good visibility seems to favor strategies with greater use of FC compared to UH at greater distances from the rescuer’s starting point to the victim. Body contact with the drowning victim requires different technical procedures that go beyond the objective of this study, e.g., techniques of approach in the last meters near the victim and possible actions of disengagement. In any case, lifeguards can substitute the use of FC at higher swimming speed in exchange for UH at distances that ensure the safety of both lifeguards and the victim.
The swimmers’ body inclination, when raising the head, favors an increase in drag (Zamparo et al., 2009). Because of this, the body produces a greater drag during UH as compared to FC. In the current study, the total metabolic energy expenditure was higher for the lifeguards during UH than FC. The energy contribution of the aerobic and anaerobic pathways was higher for UH than for FC. When compared, the three energetic metabolic pathways for FC between lifeguard and well-trained male swimmers were not similar. At least for well-trained male swimmers, it was observed that, for the distance of 100-meters at extreme intensity, 43% of the energy comes from aerobic sources, 33.1% from anaerobic lactic, and 23.5% from anaerobic alactic, values that are smaller for aerobic pathway and higher for anaerobic alactic pathway (Ribeiro et al., 2015).
The energy cost values were higher for UH than for FC. The energy cost for FC and UH were, respectively, 1.51 ± 0.24 kJ·m-1 and 1.90 ± 0.33 kJ·m-1 (p < .001), with higher values for UH. The longer test (lower swimming speed) and the swim with worse horizontal alignment justify the higher values of energy cost in UH. In high performance swimmers in 100-meter FC tests, energy cost values of 1.16 ± 0.10 kJ·m-1 were found (Ribeiro et al., 2015), lower values than were found in the present study, even with similar values of VO2peak. It should be noted that energy cost is a variable for a global evaluation of swimming, as it incorporates physiological (total energy) and biomechanical data (swimming speed) (Barbosa, Fernandes, et al., 2006). Thus, a swimmer with a lower energy cost uses less energy than a swimmer with a higher energy cost to travel the same distance. Such an outcome is of utmost importance when seeking a faster and more efficient rescue in the context of lifeguard-executed swimming.
Additionally, our results of RPE (14.6 ± 3.3 points for FC and 15.6 ± 4.0 points for UH) and LA (17.7 ± 1.4ml∙l-1 for FC and 17.8 ± 1.7 ml∙l-1 for UH) obtained after the 100 m pool test were different from those reported in tests with rescuers (N = 23, male n = 21 and female n = 2) performed in calm sea with waves smaller than 0.5 m after water rescue without floating rescue equipment (1.01 ± 2.06 ml∙l-1 and RPE 8 ± 0.77 Borg 10-point scale) (Barcala-Furelos et al., 2016). It was also found a study (N = 40, male 28 and female 12) that reported RPE of 7.4 ± 1.4 on Borg’s 10-point scale for rescue without floating rescue equipment (but using 12 and 38 cm fins) before rescue with 100 m distance in the sea (Aranda-Garcia & Herrera-Pedroviejo, 2020). Possibly, these differences are due to the constraints of different factors (Newell, 1986): means (density and water movement in pool and sea); organism (distinct samples with one of the groups with females); and task (without rescue and with rescue of an individual). It is worth noting that the support of any equipment (e.g., fins, rescue tube and rescue board) during rescues is better than no equipment (Aranda-Garcia & Herrera-Pedroviejo, 2020; Barcala-Furelos et al., 2016; Serrano Ramón & Ferriz Valero, 2018).
The results obtained from the variables studied can be used to support the lifesaving training planning and execution teams, and allow better performance in the water and visualization of the victim, reducing the energy cost for the performance of the activity. Even if it is not possible to set the swim distances at the time of each rescue, and that in aquatic rescues maximum efforts are not usually applied but submaximal efforts (Aranda-Garcia & Herrera-Pedroviejo, 2020; Barcala-Furelos et al., 2016), the results suggest that the lifeguards must present good aerobic capacity to be able to perform rescue activity. Regarding energy cost, the lifeguards presented higher values during UH than FC, and this can lead to early fatigue if performed over long distances to reach the drowning victim. In relation to energy cost, it can also be observed that lifeguards presented higher values during UH than FC, and this can lead to early fatigue if performed over long distances to reach the drowning victim.
It is also known that some lifeguards do not have a good breathing technique during swimming and always choose to swim with their heads out of the water, preventing them from being faster and more economical. It would thus be appropriate for the lifeguards to be trained to improve their swimming technique for both FC and UH. Regarding UH, it has been shown that water polo players who perform it very often during their training and games develop a great specialty which allows them to maintain swimming speed, stroke length, and stroke rate values in UH similarly to FC (Zamparo et al., 2009). Thus, we believe that if lifeguard training gives more importance to UH, lifeguards will also be able to sustain better values in the variables analyzed, resulting in a smaller energy cost during the performance of their activities.
Limitations
The main limitations of this study were: (a) the methodological infeasibility that does not allow the tests to be performed in the same conditions and environments in which the aquatic rescue activities are performed by the lifeguards; (b) No fins were used during swim tests. Some lifeguards use fins during their aquatic rescues (Barcala-Furelos et al., 2016). Possibly, future studies could provide more information on the use of fins in swimming tests, aquatic rescues and their respective energy costs; (c) the use of a snorkel for respiratory gas collection that allowed the lifeguards to breathe with their faces closer to the water line than if they were performing the approach technique without the snorkel, and which may have influenced the results of the UH. Such data from the current study can help in training planning, whether technical or physiological, in order to improve the planning of the lifeguard’s physical activities, as well as in swimming technique related to the drowning approach. We know that it will always be difficult to control all the existing variables in studies of this nature, especially since it is an activity that does not allow the prediction of the effort that will be required to perform each rescue. A greater number of studies related to this issue will make it possible to understand even more about the capabilities that should be improved in the training of lifeguards.
Conclusion
The lifeguards achieved higher swimming speed and consequently better performance in FC than in UH in a 100-meter test at maximum intensity. VO2peak, LApeak, HR, and RPE were similar between FC and UH in the 100-meter test at maximum intensity. In general, lifeguards could alternate the FC strokes with one or two UH strokes, leaving the UH for when they are closest to the victim, in order to establish the most appropriate approach. This approach technique results in higher energy costs compared to FC. Alternatively, the improvement of the UH technique is suggested so that it approaches the physiological and biomechanical characteristics of FC.
Declarations of interest
None. No funding. The study was approved by the local ethics committee (nº 2.316.201) and was performed in accordance with the Declaration of Helsinki.
References
[1] Aranda-Garcia, S., & Herrera-Pedroviejo, E. (2020). Quick Rescue self-inflating flotation device for rescuing sea swimmers in distress versus conventional tube or buoy rescues. Emergencias, 32(2), 105-110. https://www.ncbi.nlm.nih.gov/pubmed/32125109
[2] Barbosa, T. M., Fernandes, R., Keskinen, K. L., Colaco, P., Cardoso, C., Silva, J., & Vilas-Boas, J. P. (2006). Evaluation of the energy expenditure in competitive swimming strokes. Int J Sports Med, 27(11), 894-899. https://doi.org/10.1055/s-2006-923776
[3] Barbosa, T. M., Fernandes, R. J., Morouço, P. G., & Vilas-Boas, J. P. (2008). Predicting the intra-cyclic variation of the velocity of the centre of mass from segmental velocities in butterfly stroke: a pilot study. J Sports Sci Med, 7(2), 201-209. http://www.ncbi.nlm.nih.gov/pubmed/24149450
[4] Barbosa, T. M., Lima, F., Portela, A., Novais, D., Machado, L., Colaço, P., Gonçalves, P., Fernandes, R., Keskinen, K. L., & Vilas-Boas, J. P. (2006). Relationships between energy cost, swimming velocity and speed fluctuation in competitive swimming strokes. Portuguese J Sports Sci, 6(2), 192-194.
[5] Barcala-Furelos, R., Szpilman, D., Palacios-Aguilar, J., Costas-Veiga, J., Abelairas-Gomez, C., Bores-Cerezal, A., Lopez-Garcia, S., & Rodriguez-Nunez, A. (2016). Assessing the efficacy of rescue equipment in lifeguard resuscitation efforts for drowning. Am J Emerg Med, 34(3), 480-485. https://doi.org/10.1016/j.ajem.2015.12.006
[6] Binzoni, T., Ferretti, G., Schenker, K., & Cerretelli, P. (1992). Phosphocreatine hydrolysis by 31P-NMR at the onset of constant-load exercise in humans. J Appl Physiol (1985), 73(4), 1644-1649. https://doi.org/10.1152/jappl.1992.73.4.1644
[7] Borg, G. (1998). Borg’s perceived exertion and pain scales. Human Kinetics.
[8] Capelli, C., Pendergast, D., & Termin, B. (1998). Energetics of swimming at maximal speeds in humans. Eur J Appl Physiol Occup Physiol, 78(5), 385-395. https://doi.org/10.1007/s004210050435
[9] Chan, J. S., Ng, M. X., & Ng, Y. Y. (2018). Drowning in swimming pools: clinical features and safety recommendations based on a study of descriptive records by emergency medical services attending to 995 calls. Singapore Med J, 59(1), 44-49. https://doi.org/10.11622/smedj.2017021
[10] De Jesus, K., De Jesus, K., Figueiredo, P., Vilas-Boas, J. P., Fernandes, R. J., & Machado, L. J. (2015). Reconstruction accuracy assessment of surface and underwater 3D motion analysis: a new approach. Comput Math Methods Med, 2015, 269264. https://doi.org/10.1155/2015/269264
[11] De Jesus, K., Guidetti, L., De Jesus, K., Vilas-Boas, J. P., Baldari, C., & Fernandes, R. J. (2014). Which are the best VO2 sampling intervals to characterize low to severe swimming intensities? Int J Sports Med, 35(12), 1030-1036. https://doi.org/10.1055/s-0034-1368784
[12] Di Prampero, P. E. (1986). The energy cost of human locomotion on land and in water. Int J Sports Med, 7(2), 55-72. https://doi.org/10.1055/s-2008-1025736
[13] Figueiredo, P., Barbosa, T. M., Vilas-Boas, J. P., & Fernandes, R. J. (2012). Energy cost and body centre of mass’ 3D intracycle velocity variation in swimming. Eur J Appl Physiol, 112(9), 3319-3326. https://doi.org/10.1007/s00421-011-2284-6
[14] Figueiredo, P., Toussaint, H. M., Vilas-Boas, J. P., & Fernandes, R. J. (2013). Relation between efficiency and energy cost with coordination in aquatic locomotion. Eur J Appl Physiol, 113(3), 651-659. https://doi.org/10.1007/s00421-012-2468-8
[15] Figueiredo, P., Zamparo, P., Sousa, A., Vilas-Boas, J. P., & Fernandes, R. J. (2011). An energy balance of the 200 m front crawl race. Eur J Appl Physiol, 111(5), 767-777. https://doi.org/10.1007/s00421-010-1696-z
[16] Gámez de la Hoz, J. J., & Padilla Fortes, A. (2017). Ahogamientos asociados con piscinas implicados en casos judiciales de España, 2000-2015. Rev Andal Med Deporte, 10(3), 106-111. Spanish. https://doi.org/https://dx.doi.org/10.1016/j.ramd.2016.07.005
[17] Gonjo, T., McCabe, C., Sousa, A., Ribeiro, J., Fernandes, R. J., Vilas-Boas, J. P., & Sanders, R. (2018). Differences in kinematics and energy cost between front crawl and backstroke below the anaerobic threshold. Eur J Appl Physiol, 118(6), 1107-1118. https://doi.org/10.1007/s00421-018-3841-z
[18] Idris, A. H., Bierens, J. J. L. M., Perkins, G. D., Wenzel, V., Nadkarni, V., Morley, P., Warner, D. S., Topjian, A., Venema, A. M., Branche, C. M., Szpilman, D., Morizot-Leite, L., Nitta, M., Løfgren, B., Webber, J., Gräsner, J.-T., Beerman, S. B., Youn, C. S., Jost, U., Quan, L., Dezfulian, C., Handley, A. J., & Hazinski, M. F. (2017). 2015 revised Utstein-style recommended guidelines for uniform reporting of data from drowning-related resuscitation: An ILCOR advisory statement. Resuscitation, 118, 147-158. https://doi.org/10.1016/j.resuscitation.2017.05.028
[19] Jeong, J., Hong, K. J., Shin, S. D., Ro, Y. S., Song, K. J., Lee, E. J., Lee, Y. J., & Ahn, K. O. (2016). Relationship between drowning location and outcome after drowning-associated out-of-hospital cardiac arrest: nationwide study. Am J Emerg Med, 34(9), 1799-1803. https://doi.org/10.1016/j.ajem.2016.06.008
[20] Laffite, L. P., Vilas-Boas, J. P., Demarle, A., Silva, J., Fernandes, R., & Billat, V. L. (2004). Changes in physiological and stroke parameters during a maximal 400-m free swimming test in elite swimmers. Can J Appl Physiol, 29 Suppl, S17-31. https://doi.org/10.1139/h2004-055.
[21] Newell, K. M. (1986). Constraints on the development of coordination. En M. G. W. H. T. A. Whiting (Ed.), Motor development in children: aspect of coordination and control (pp. 341-360). Martinus Nijhoff.
[22] Ozyener, F., Rossiter, H. B., Ward, S. A., & Whipp, B. J. (2001). Influence of exercise intensity on the on- and off-transient kinetics of pulmonary oxygen uptake in humans. J Physiol, 533 (Pt 3), 891-902. https://doi.org/10.1111/j.1469-7793.2001.t01-1-00891.x
[23] Pendergast, C., Capelli, A. B., Craig Jr., P. E., Di Prampero, A. E., Minetti, J., Mollendorf, A., Termin II, P., & Zamparo, P. (2006). Biophysics in swimming. Rev Port Cien Desp, 6(2), 185-197.
[24] Pendergast, D. R., Moon, R. E., Krasney, J. J., Held, H. E., & Zamparo, P. (2015). Human physiology in an aquatic environment. Compr Physiol, 5(4), 1705-1750. https://doi.org/10.1002/cphy.c140018
[25] Ribeiro, J., Figueiredo, P., Sousa, A., Monteiro, J., Pelarigo, J., Vilas-Boas, J. P., Toussaint, H. M., & Fernandes, R. F. (2015). VO(2) kinetics and metabolic contributions during full and upper body extreme swimming intensity. Eur J Appl Physiol, 115(5), 1117-1124. https://doi.org/10.1007/s00421-014-3093-5
[26] Rosenthal, J. A. (1996). Qualitative Descriptors of Strength of Association and Effect Size. Journal of Social Service Research, 21(4), 37-59. https://doi.org/10.1300/J079v21n04_02
[27] Schwebel, D. C., Lindsay, S., & Simpson, J. (2007). Brief report: a brief intervention to improve lifeguard surveillance at a public swimming pool. J Pediatr Psychol, 32(7), 862-868. https://doi.org/10.1093/jpepsy/jsm019
[28] Serrano Ramón, J. M., & Ferriz Valero, A. (2018). Use of Floating Material in Swimming. Apunts Educación Física y Deportes (132), 48-59. https://doi.org/https://doi.org/10.5672/apunts.2014-0983.es.(2018/2).132.04
[29] Szpilman, D., Tipton, M., Sempsrott, J., Webber, J., Bierens, J., Dawes, P., Seabra, R., Barcala-Furelos, R., & Queiroga, A. C. (2016). Drowning timeline: a new systematic model of the drowning process. Am J Emerg Med, 34(11), 2224-2226. https://doi.org/10.1016/j.ajem.2016.07.063
[30] Toussaint, H. M., & Hollander, A. P. (1994). Energetics of competitive swimming. Implications for training programmes. Sports Med, 18(6), 384-405. https://doi.org/10.2165/00007256-199418060-00004.
[31] Vignac, E., Lebihain, P., & Soule, B. (2017). Constant supervision of bathing in French public swimming pools: an unrealistic regulatory requirement? Int J Inj Contr Saf Promot, 24(3), 371-381. https://doi.org/10.1080/17457300.2016.1200630
[32] Wallis, B. A., Watt, K., Franklin, R. C., Taylor, M., Nixon, J. W., & Kimble, R. M. (2015). Interventions associated with drowning prevention in children and adolescents: systematic literature review. Inj Prev, 21(3), 195-204. https://doi.org/10.1136/injuryprev-2014-041216
[33] Zamparo, P., Capelli, C., & Pendergast, D. R. (2011). Energetics of swimming: a historical perspective. Eur J Appl Physiol, 111(3), 367-378. https://doi.org/10.1007/s00421-010-1433-7
[34] Zamparo, P., Capelli, C., Termin, B., Pendergast, D. R., & Di Prampero, P. E. (1996). Effect of the underwater torque on the energy cost, drag and efficiency of front crawl swimming. Eur J Appl Physiol Occup Physiol, 73(3-4), 195-201. https://doi.org/10.1007/BF02425476.
[35] Zamparo, P., Gatta, G., Pendergast, D. R., & Capelli, C. (2009). Active and passive drag: the role of trunk incline. Eur J Appl Physiol, 106(2), 195-205. https://doi.org/10.1007/s00421-009-1007-8
ISSN: 2014-0983
Received: October 14, 2020
Accepted: April 31, 2021
Published: October 1, 2021
Editor: © Generalitat de Catalunya Departament de la Presidència Institut Nacional d’Educació Física de Catalunya (INEFC)
© Copyright Generalitat de Catalunya (INEFC). This article is available from url https://www.revista-apunts.com/. This work is licensed under a Creative Commons Attribution-NonCommercial-NoDerivatives 4.0 International License. The images or other third party material in this article are included in the article’s Creative Commons license, unless indicated otherwise in the credit line; if the material is not included under the Creative Commons license, users will need to obtain permission from the license holder to reproduce the material. To view a copy of this license, visit https://creativecommons.org/licenses/by-nc-nd/4.0/deed.en


