Hysteresis Area of Psychobiological Variables. A New Non-Invasive Biomarker of Effort Accumulation?
Lluc Montull

Óscar Abenza
Robert Hristovski
Natàlia Balagué
*Corresponding author: Natàlia Balagué nbalague@gencat.cat
Cite this article
Montull, L., Abenza, O., Hristovski, R. & Balagué, N. (2023). Hysteresis Area of Psychobiological Variables. A New Non-Invasive Biomarker of Effort Accumulation? Apunts Educación Física y Deportes, 152, 55-61. https://doi.org/10.5672/apunts.2014-0983.es.(2023/2).152.06
Abstract
The hysteresis area, which reflects the history-dependency of psychobiological parameters, has been recently suggested as a new non-invasive marker of exercise stress and tolerance. However, its promising applications are still underexplored. This study aims to test if the hysteresis area of the perceived exertion (RPE), heart rate (HR), and muscle oxyhaemoglobin concentration (muscle O2Hb) are sensitive to effort accumulation over multiple bouts of running exercise. Ten physical education students performed five consecutive running bouts at maximal aerobic velocity. The consecutive bouts started when participants reported at least an RPE ≤ 11 (Borg’s 6-20 scale). The hysteresis areas of RPE, HR, and muscle O2Hb were calculated for each bout, and their magnitude was compared using Friedman ANOVA and Wilcoxon test. Effect sizes were calculated through Cohen’s d. The hysteresis areas of all studied variables changed between the initial and final bouts: RPE and HR increased (between bouts 1-4: Z = –1.99, p = .04; Z = –2.19, p = .03, respectively), and muscle O2Hb decreased (between bouts 1-4: Z = –2.80, p < .01). Large effect sizes (d = 1.22 – 1.81) were found in HR between bouts 1-4, 1-5, 2-4, 2-5, and muscle O2Hb between bouts 1-4 and 1-5. The results showed that the hysteresis areas of RPE, HR, and muscle O2Hb were sensitive to effort accumulation during repeated running exercises performed at maximal aerobic velocity. Despite further research is warranted, the hysteresis area of psychobiological variables points towards being a sensitive biomarker for monitoring acute fatigue.
Introduction
In biology, the hysteresis phenomenon refers to the history-dependency (i.e., path-dependency) of the system under study, a hallmark of its complex nature. Featured by self-organized and nonlinear dynamics (Hristovski et al., 2010, 2014), it is often ignored in exercise monitoring and exercise science (Balagué et al., 2020). It explains how the studied parameter returns to its initial state with a certain delay after being perturbed and why several states of this parameter may coexist for the same quantitative value. For instance, the same lactic acid concentration value can be found in two different physiological conditions: during exercise and at rest (e.g., during exercise recovery). The phenomenon occurs because the system depends on its history, consequently, the preferred behavioural trajectories of the studied variable are different when the control parameter is being systematically varied in opposite directions (Hristovski et al., 2014).
The hysteresis phenomenon of diverse parameters has been studied in different health-related fields such as physiology (Liu et al., 2014), biomechanics (Butler et al., 1978), and medicine (Cabasson et al., 2012). Recently, the hysteresis behaviour of psychobiological variables has been proposed as a non-invasive marker of exercise workload stress and tolerance (Montull et al., 2020) and has been applied to study the detraining effects of standardized training programs (Martín-Guillaumes et al., 2021). However, its applications and monitoring possibilities are still underexplored.
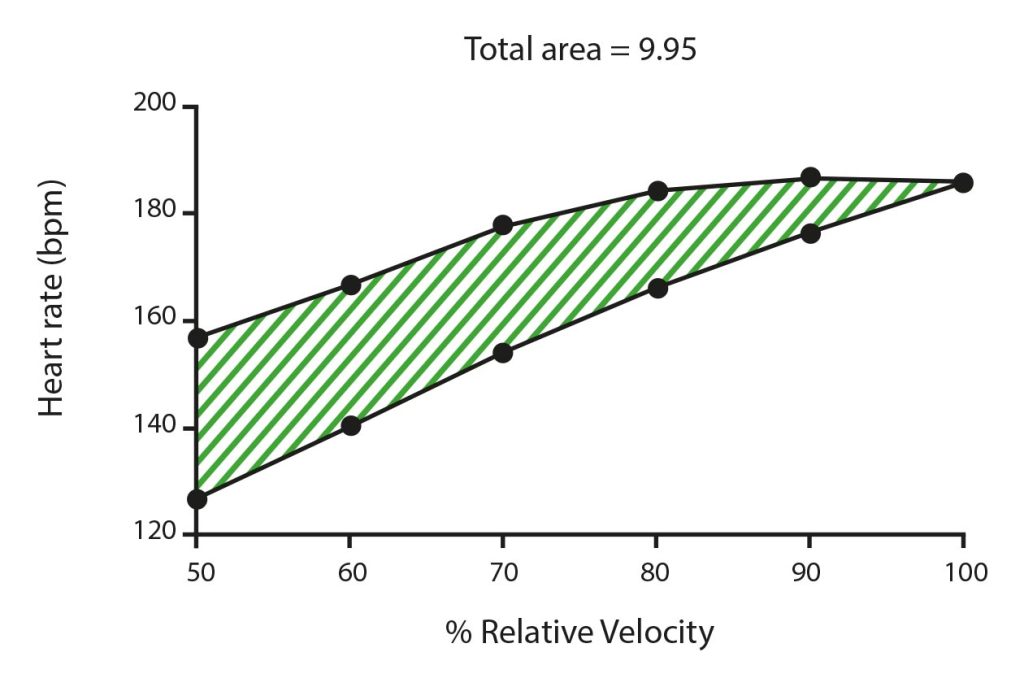
The hysteresis of a specific variable can be quantified through the hysteresis area, which reflects the amount of dissipated energy after the variable recovery (Mayergoyz, 2003). Figure 1 represents the hysteresis area by the space between the incremental and decremental phases of a pyramidal effort protocol. Montull et al. (2020) showed that a lower hysteresis area of rating of perceived exertion (RPE) and heart rate (HR) is associated with higher athlete’s expertise and higher recovery efficiency. Accordingly, the authors suggested that the hysteresis area of psychobiological variables may also be sensitive to the effort accumulation, which is hardly captured through current conventional data analysis techniques and assessment protocols (Halson, 2014).
Considering fatigue as a product of multidimensional, multiscale and environmental-dependent network interactions, the commonly provided fixed quantitative values of isolated variables or multiple timeless metrics to define it, may be insufficient and often imprecise to inform about it (Balagué et al., 2020). This timeless assessment, based on an oversimplified and distorted conception of the organism as a complex adaptive system (CAS), ignores the nonlinear and fluctuating dynamics of athletes’ behaviour and the idiosyncrasy of their dynamic responses to exercise (Nesselroade & Molenaar, 2010). For this reason, the network physiology of exercise framework promotes the assessment of CAS’ properties like the hysteresis and the use of individual time series analysis for assessing physiological states (Balagué et al., 2020).
The ignorance of the hysteresis response in specific types of training like interval training may lead to an inadequate prescription of bouts of exercise and recovery times. Exercise bouts are commonly based on preestablished intensities and fixed psychobiological values (e.g., HR corresponding to the anaerobic threshold) and the recovery times on fixed metabolic-based assumptions (e.g., phosphagen system lasts 2-5 min to be recharged) (Wilmore et al., 2008).
The hysteresis response to exercise is far unknown. Only RPE, HR, and a few related variables explored for cardiovascular disease detection (Cabasson et al., 2012) have been studied. The hysteresis area of muscle oxygen saturation (muscle O2Hb) (Hamaoka et al., 2011) may add information about how CAS compensate at microscopic level the increasing demands of an accumulated effort.
In view of the above, this study aimed to test the sensitiveness of the hysteresis area of the RPE, HR, and muscle O2Hb to effort accumulation over multiple bouts of running exercise. The hypothesis is that RPE and HR areas will increase over the bouts, while muscle O2Hb areas will decrease because the accumulated effort reduces oxygen saturation.
Methodology
Participants
Ten volunteer sport science students (five males and five females: 20.50 ± 2.22 years; 1.74 ± 0.08 m; 64.25 ± 11.57 kg), exercising between five and eight h/week, and following a healthy and active lifestyle participated in the study. A large effect size ρ = 1, α = .05, and power (1-β) = .85 was used to determine the sample size. All experimental procedures were explained to participants before they gave their written consent to participate. The experiment was approved by the Local Research Ethics Committee of the Sports Administration of Catalonia (072015CEICEGC) and carried out according to the Helsinki Declaration.
Testing protocols
Maximal aerobic velocity (MAV) test
An incremental and maximal treadmill test (h/p Cosmos Pulsar 3p®) was performed to obtain the MAV of each participant. The test started at 8 km/h for males and 6 km/h for females, and the velocity was increased 1 km/h every 100 s until they could not keep the imposed velocity. The final velocity maintained along the 100 s was considered the MAV. This test was also used to familiarise the participants with Borg’s 6-to-20 RPE scale.
Multiple bouts test
One week after performing the MAV test, they performed the multiple bouts test. After a warm-up of 5 min at 8 km/h, participants performed five consecutive running bouts of 100 s at 100% of MAV (30 to 120 s is recommended for tests of lactic anaerobic capacity, Medbo & Tabata, 1993). They rested between bouts until they recorded RPE ≤ 11 (light) in a 6-to-20 Borg scale. After each bout, they responded to the question: “What is your perceived exertion at this moment?”. The Borg’s 6-to-20 RPE scale was placed in a visible place.
Participants were not informed about the number of bouts they had to perform to avoid manipulations of the recovery periods. During the test, they could not talk. At the end, they were requested about their sensations and could ask questions.
Data acquisition
HR (Polar Electro Oy, Finland) and muscle O2Hb (PortaMon, Artinis, Medical System), as one of the most direct variables of muscle oxygen saturation (McManus et al., 2018), were continuously monitored during the exercise. PortaMon (Near-infrared spectroscopy device), recording at a sampling frequency of 10 Hz, was placed on the external vast of the quadriceps of the participants (McManus et al., 2018). The values were collected every 25 s, at the same time as RPE was recorded.
Data analysis
Hysteresis areas calculation
Hysteresis areas of the studied psychobiological variables were calculated according to Montull et al. (2020). The space between the exercise and the recovery phases was considered for each variable and bout. Given that the workload was constant in all bouts of exercise and null during the recovery, the control parameter selected was the effort-recovery length (τ). It corresponded to the current time of exercise or recovery divided by the total time of exercise (100 s). The studied variables and the τ were normalized from 0 to 10 to relativize them in the same scale before calculating the areas. We calculated the total hysteresis area as the sum of positive and negative partial areas. While positive areas were considered when the recovery phase values were higher than in the exercise phase, the negative areas were considered when the recovery phase values were lower than in the exercise phase (see Figure 2 as an example). In case the recovery phase was longer than the exercise phase, we applied the same logic: until the recovery values were not lower than the initial exercise value, the area was not considered negative. Matlab R2020a was used for this calculation.

Statistical analysis
After demonstrating a non-normal distribution, Friedman ANOVA, and then, Wilcoxon test were applied to compare the differences of a) hysteresis areas among all bouts (for each variable), b) initial values of variables between the consecutive bouts, and c) hysteresis areas among the three studied variables. Cohen’s d was also calculated for hysteresis areas and initial values of each variable between the initial (1-2) and final (4-5) bouts. According to Cohen’s (1988) guidelines, d ≥ .2, d ≥ .5, d ≥ 0.8, represent small, intermediate, and large effect sizes, respectively. The level of significance was set at p ≤ .05 throughout the study. Statistical analyses were performed with SPSS v.15 (SPSS Inc., Chicago, USA).
Results
Table 1 shows the values of the hysteresis areas and initial values of RPE, HR, and muscle O2Hb for each bout of exercise. Also, it displays how the resting recovery time between bouts increased with effort accumulation. Table 2 shows the effect sizes and significant differences in the hysteresis areas and initial values of RPE, HR, and muscle O2Hb between the initial and final bouts.

Table 1
Median and interquartile values of the total hysteresis areas (sum of positive and negative areas) and initial values of rating of perceived exertion (RPE), heart rate (HR), and muscle oxyhaemoglobin (O2Hb) for the five-consecutive bouts. Median and interquartile of recovery time between the bouts is also included.
Table 2
Differences between the initial and final bouts of hysteresis areas and initial values of rating of perceived exertion (RPE), heart rate (HR), and muscle oxyhaemoglobin (O2Hb). Cohen’s d is represented in values, while significant differences from the Wilcoxon test are marked (*p < .05).
The HR areas increased over the bouts (χ2 = 14.16, p < .01), and the muscle O2Hb areas decreased (χ2 = 9.84, p = .04). The differences were significant between the initial (1 and 2) and final bouts (4 and 5): HR (1-4: Z = –2.19, p = .03; 2-4: Z = –2.09, p = .04; 1-5: Z = –2.29, p = .02; 2-5: Z = –2.60, p < .01) and muscle O2Hb (1-4: Z = –2.80, p < .01; 1-5: Z = –2.19, p = .03). As shown in Table 2, large effect sizes (d = 1.22 – 1.81) of hysteresis areas were found in HR between bouts 1-4, 1-5, 2-4, 2-5, and in muscle O2Hb between bouts 1-4 and 1-5. RPE increased only between bouts 1 and 3 and bout 4 (Z = –1.98, p = .04; Z = –1.99, p = .04, respectively), with small and intermediate effect sizes between initial and final bouts.
All areas showed a large interquartile and displayed high differences among the variables (χ2 = 59.08, p < .01). Concretely, between muscle O2Hb with both HR (Z = –6.11, p < .01) and RPE (Z = –6.00,p < .01).
On the other hand, there were non-significant differences between the initial values of the consecutive bouts (see Tables 1 and 2). Only RPE and muscle O2Hb were different between bouts 1 and 2 (Z = –2.35, p = .02; Z = –2.80, p < .01, respectively). In addition, small and intermediate effect sizes were displayed between initial and final bouts of such initial values (except for HR between bouts 1-5).
Discussion
This research, assessing the hysteresis areas of RPE, HR, and muscle O2Hb during repeated running bouts, found an increase in RPE and HR areas, and a decrease in muscle O2Hb areas, in the last bouts compared with the first ones.
The muscle O2Hb hysteresis areas decreased as effort accumulated, reinforcing the hypothesis of the hysteresis area as a possible biomarker of exercise stress and tolerance (Montull et al., 2020). It informed about the differences between internal and external load (MAV was kept in all bouts) in function of effort accumulation. This difference was also reflected by the increase in the recovery time over the bouts.
In contrast to the hysteresis areas, the initial values of RPE, HR, and muscle O2Hb before the bouts were quite similar. These results support the assumption that fixed quantitative values of RPE, HR, and muscle O2Hb cannot be sufficiently reliable as indicators of internal load (Montull et al., 2020, 2022).
The degeneracy property of CAS (Edelman & Gally, 2001; Montull et al., 2020) may explain why participants could keep the same velocity along the bouts despite the psychobiological effects of effort accumulation. Different psychobiological synergies should be activated when effort accumulates to compensate the fatigue effects and satisfy the task goal.
According to the results, psychobiological synergies were highly individual and contextual. The hysteresis areas of RPE, HR, and muscle O2Hb were notably different over the bouts, as shown by their high statistical dispersion. These findings support previous results studying RPE and HR (Montull et al., 2020) and the non-proportional relations found between internal and external loads (Impellizzeri et al., 2019).
Although the recovery time increased as running bouts progressed, the hysteresis areas of RPE and HR also increased, switching from negative to positive values after the third bout. This transition indicates that RPE and HR recovery values were higher than exercise values until RPE decreased below 11. This phenomenon informs about the impending instability of psychobiological synergies (Hristovski et al., 2014), which can be used as an early warning signal (Scheffer et al., 2009) to help “forecast” the exhaustion and task disengagement provoked by acute fatigue effects. Accordingly, the possibilities to capture and anticipate such effects seem possible using the hysteresis area of psychobiological variables.
Monitoring the hysteresis area has also been effective in capturing the efficacy of training interventions (Martín-Guillaumes et al., 2021) and increasing the diagnostic accuracy in cardiac diseases (Zimarino et al., 2016). Thus, these findings reinforce its potential for monitoring sports and medical interventions. In sport, it may help to manage the recovery during exercise and post-exercise with more precision (Montull et al., 2020). The access to instantaneous values of the hysteresis area of psychobiological variables during an intervallic training may allow athletes and coaches to control more adequately the training workloads (frequency, duration, intensity, recovery). This is in line with recent proposals pointing towards avoiding preestablished working/resting exercise times (i.e., recipes), but promoting a continuous adaptation of training workloads to the changing fitness states of athletes and teams (Balagué et al., 2019, 2020; Pol et al., 2020).
Despite its potential, the hysteresis area of physiological variables may not provide accurate information about the effort accumulation. Subjective perceptions, able to compress multiple information of interoceptive and exteroceptive channels and, therefore, reflect the internal workload in a more integrated manner, maybe a good monitoring complement (Montull et al., 2022).
This study used only the RPE to control the recovery time. Future research is warranted to add other variables like HR to control the recovery period. Further research is also warranted to study the hysteresis area of psychobiological variables in populations with different health and training/fitness states. Finally, this study stresses the importance of developing some technology with the capacity to monitor and assess the hysteresis response during exercise instantaneously.
Conclusions
This study showed the sensitiveness of the hysteresis area of RPE, HR, and muscle O2Hb to effort accumulation during repeated running exercises performed at MAV. The hysteresis area of psychobiological and physiological variables promises to be a new biomarker for monitoring acute fatigue and assessing health and performance states.
References
[1] Balagué, N., Hristovski, R., Almarcha, M., Garcia-Retortillo, S., & Ivanov, P. C. (2020). Network physiology of exercise: Vision and perspectives. Frontiers in Physiology, 11, 1607. https://doi.org/10.3389/FPHYS.2020.611550
[2] Balagué, N., Pol, R., & Guerrero, I. (2019). Science or pseudoscience of physical activity and sport? Apunts Educación Física y Deportes, 136, 129-136. http://dx.doi.org/10.5672/apunts.2014-0983.es.(2019/2).136.09
[3] Butler, D., Grood, E., Noyes, F., & Zernicke, R. (1978). Biomechanics of ligaments and tendons. Exercise and Sport Sciences Reviews, 6, 125–181.
[4] Cabasson, A., Meste, O., Bailon, R., & Laguna, P. (2012). Validation of the PR-RR hysteresis phenomenon. Computing in Cardiology, 39, 597–600.
[5] Cohen, J. (1988). Statistical power analysis for the behavioral sciences (2nd ed.). New York: Routledge. https://doi.org/10.4324/9780203771587
[6] Edelman, G. M., & Gally, J. A. (2001). Degeneracy and complexity in biological systems. Proceedings of the National Academy of Sciences of the United States of America, 98(24), 13763–13768. https://doi.org/10.1073/pnas.231499798
[7] Halson, S. L. (2014). Monitoring training load to understand fatigue in athletes. Sports Medicine, 44(S2), 139–147. https://doi.org/10.1007/s40279-014-0253-z
[8] Hamaoka, T., McCully, K. K., Niwayama, M., & Chance, B. (2011). The use of muscle near-infrared spectroscopy in sport, health and medical sciences: Recent developments. Philosophical Transactions of the Royal Society A: Mathematical, Physical and Engineering Sciences, 369(1955), 4591–4604. https://doi.org/10.1098/rsta.2011.0298
[9] Hristovski, R., Balagué, N., & Schöllhorn, W. (2014). Basic notions in the science of complex systems and nonlinear dynamics. In K. Davids, R. Hristovski, D. Araújo, N. Balague, C. Button, & P. Passos (Eds.), Complex Systems in Sport (1st ed., pp. 3–17). London: Routledge. https://doi.org/10.4324/9780203134610
[10] Hristovski, R., Venskaityte, E., Vainoras, A., Balagué, N., & Vazquez, P. (2010). Constraints-controlled metastable dynamics of exercise-induced psychobiological adaptation. Medicina, 46(7), 447–453. https://doi.org/10.3390/medicina46070064
[11] Impellizzeri, F. M., Marcora, S. M., & Coutts, A. J. (2019). Internal and external training load: 15 years on. International Journal of Sports Physiology and Performance, 14(2), 270–273. https://doi.org/10.1123/ijspp.2018-0935
[12] Liu, Q., Yan, B. P., Yu, C. M., Zhang, Y. T., & Poon, C. C. Y. (2014). Attenuation of systolic blood pressure and pulse transit time hysteresis during exercise and recovery in cardiovascular patients. IEEE Transactions on Biomedical Engineering, 61(2), 346–352. https://doi.org/10.1109/TBME.2013.2286998
[13] Martín-Guillaumes, J., Montull, L., Ventura, J. L., Javierre, C., Aragonés, D., & Balagué, N. (2021). Response variability and detraining effects of standardized exercise programs. Austin Sports Medicine, 6(1):1048. https://doi.org/10.26420/austinsportsmed.2021.1048
[14] Mayergoyz, I. D. (2003). Mathematical models of hysteresis and their applications. Electromagnetism (2nd ed.). London: Academic Press.
[15] McManus, C. J., Collison, J., & Cooper, C. E. (2018). Performance comparison of the MOXY and PortaMon near-infrared spectroscopy muscle oximeters at rest and during exercise. Journal of Biomedical Optics, 23(1), 1. https://doi.org/10.1117/1.jbo.23.1.015007
[16] Medbo, J. I., & Tabata, I. (1993). Anaerobic energy release in working muscle during 30 s to 3 min of exhausting bicycling. Journal of Applied Physiology, 75(4), 1654–1660. https://doi.org/10.1152/jappl.1993.75.4.1654
[17] Montull, L., Slapšinskaitė-Dackevičienė, A., Kiely, J., Hristovski, R., & Balagué, N. (2022). Integrative proposals of sports monitoring: Subjective outperforms objective monitoring. Sports Medicine-Open, 8(41). https://doi.org/10.1186/s40798-022-00432-z
[18] Montull, L., Vázquez, P., Hristovski, R., & Balagué, N. (2020). Hysteresis behaviour of psychobiological variables during exercise. Psychology of Sport and Exercise, 48, 1–9. https://doi.org/10.1016/j.psychsport.2020.101647
[19] Nesselroade, J. R., & Molenaar, P. C. (2010). Analyzing intra-person variation: Hybridizing the ACE model with P-technique factor analysis and the idiographic filter. Behavior Genetics, 40(6), 776–783. https://doi.org/10.1007/s10519-010-9373-x
[20] Pol, R., Balagué, N., Ric, A., Torrents, C., Kiely, J., & Hristovski, R. (2020). Training or synergizing? Complex systems principles change the understanding of sport processes. Sports Medicine - Open, 6(1). https://doi.org/10.1186/s40798-020-00256-9
[21] Scheffer, M., Bascompte, J., Brock, W. A., Brovkin, V., Carpenter, S. R., Dakos, V., Held, H., Van Nes, E. H., Rietkerk, M., & Sugihara, G. (2009). Early-warning signals for critical transitions. Nature, 461(7260), 53–59. https://doi.org/10.1038/nature08227
[22] Wilmore, J. H., Costill, D. L., & Kenney, W. L. (2008). Physiology of sport and exercise. Champaign, IL: Human Kinetics.
[23] Zimarino, M., Montebello, E., Radico, F., Gallina, S., Perfetti, M., Iachini Bellisarii, F., Severi, S., Limbruno, U., Emdin, M., & De Caterina, R. (2016). ST segment/heart rate hysteresis improves the diagnostic accuracy of ECG stress test for coronary artery disease in patients with left ventricular hypertrophy. European Journal of Preventive Cardiology, 23(15), 1632–1639. https://doi.org/10.1177/2047487316655259
ISSN: 2014-0983
Received: July 1, 2022
Accepted: November 10, 2022
Published: April 1, 2023
Editor: © Generalitat de Catalunya Departament de la Presidència Institut Nacional d’Educació Física de Catalunya (INEFC)
© Copyright Generalitat de Catalunya (INEFC). This article is available from url https://www.revista-apunts.com/. This work is licensed under a Creative Commons Attribution-NonCommercial-NoDerivatives 4.0 International License. The images or other third party material in this article are included in the article’s Creative Commons license, unless indicated otherwise in the credit line; if the material is not included under the Creative Commons license, users will need to obtain permission from the license holder to reproduce the material. To view a copy of this license, visit https://creativecommons.org/licenses/by-nc-nd/4.0/deed.en


