Validation and Reliability of The WheelerJump Sensor for the Execution of the Countermovement Jump
Brayan Esneider Patiño-Palma

Carlos Andrés Wheeler-Botero
Carlos Alberto Ramos-Parrací
*Corresponding author: Brayan Esneider Patiño-Palma bepatino@uniboyaca.edu.co
Cite this article
Patiño-Palma, B. E., Wheeler-Botero, C. A., & Ramos-Parrací, C. A. (2022). Validation and Reliability of The WheelerJump Sensor for the Execution of the Countermovement Jump. Apunts Educación Física y Deportes, 149. 37-44. https://doi.org/10.5672/apunts.2014-0983.es.(2022/3).149.04
Abstract
Many coaches have used the vertical jump as an indicator of neuromuscular performance. In this study, a total of 119 high-performance athletes from different sports disciplines were selected in a non-probabilistic and convenient manner. Jump performance was evaluated through the CMJ in a training session using the Chronojump Boscosystem contact platform, the OptoGait photoelectric system and the My Jump 2 mobile application as measurement tools, comparing the results with the values obtained with the Wheeler Jump sensor. Statistically significant validity and reliability were established (Wheeler Jump vs OptoGait ICC .997-.998, p<.001; Wheeler Jump vs My Jump 2 ICC .991 – .995, p < .001; Wheeler Jump vs ChronoJump ICC .995-.997, p<.001), thus determining that the Wheeler Jump sensor is a reliable tool that provides professionals and researchers with accurate information regarding changes in the physical performance of athletes.
Introduction
Historically, the vertical jump has been used as an indicator of neuromuscular performance by many coaches of different disciplines in the world (Montalvo et al., 2021). During the decade of the sixties, Professor Rodolfo Margaria was the first person to talk about the relevance of the so-called Stretch-Shortening Cycle (SSC) stating that a concentric contraction preceded by an eccentric one could generate higher levels of strength than an isolated concentric contraction (García-López et al., 2003).
Most sports movements and actions comply with this SSC, thus facilitating concentric contractions or propulsive phases; for that reason, the jump that has been most popular in the sports field as an indicator of neuromuscular efficiency has been the Countermovement Jump (CMJ), which has been described in the literature as a determinant of the elastic explosive manifestation of strength (Garrido-Chamorro & González-Lorenzo, 2004). For the evaluation of the CMJ, the most used protocol has been the Bosco test, performed through a contact platform, which allows the evaluation and characterization of the functional parameters of the jump in each of the athletes and also allows the measurement of the strength of the lower extremities (Tejada & Suarez, 2013).
There is ample scientific evidence regarding the use of the vertical jump as an indicator of sports performance (Tejada & Suarez, 2013). Accordingly, a wide variety of technological tools can be used for the evaluation of this parameter, ranging from those that are exclusively for laboratory use to the use of portable instruments for field evaluation.
In this sense, strength platforms have been considered the most reliable and validated instrument for the evaluation of lower limb strength and power through vertical jumping (Bosco et al., 1983a). Nevertheless, the cost of this instrument continues to be a barrier for most trainers and/or physiotherapists. However, the evaluation of strength from the height of the jump estimated by the time of flight has become a validated, accepted and low-cost technique for the evaluation of neuromuscular efficiency during the jump (Bosco et al., 1983b; Harman et al., 1991).
Some measuring tools or instruments such as contact mats such as the Chronojump Boscosystem (ICC 0.95) (De Blas et al., 2012), and/or photo-optical systems such as the OptoGait (ICC 0.99) (Lee et al., 2014) are used to determine the height of the vertical jump, measuring the time of flight as established by Bosco et al. (1983b).
These optical systems present an advantage compared to force platforms and contact mats; this advantage is to be able to perform the jump assessment on the same surfaces where the athlete competes or trains (Bosquet et al., 2009).
One of the latest technological advances in instruments for the assessment of vertical jump is the mobile application
My Jump 2 created by the author Carlos Balsalobre-Fernández (Balsalobre-Fernández et al., 2015a) demonstrating that the CMJ can be measured validly and reliably through the application. In this sense, Gallardo-Fuentes et al. (2016) proved that this application is a tool with high reliability and intersession and intrasession validity to measure vertical jump performance in male and female athletes, on different days.
As an alternative evaluation instrument, the Wheeler Jump photoelectric sensor has been developed. It is a wireless, portable and lightweight system that, through a mobile application, allows to assess the vertical jump estimating the height through the flight time. The novelty of Wheeler Jump is the connectivity via Bluetooth to the cellphone or tablet, making it easier for the trainer to evaluate.
Therefore, in order to make a scientific use of the Wheeler Jump photoelectric sensor, this validation study is carried out comparing it with three scientifically validated evaluation systems: Chronojump Boscosystem (Barcelona, Spain), OptoGait (Bolzano, Italy), and the mobile application My Jump 2. In this sense, the objective of this study was to establish the validity and reliability of the Wheeler Jump sensor for the execution of the CMJ in athletes from different sports disciplines, having as an hypothesis that the results obtained by the Wheeler Jump sensor do not vary from the results obtained with the three evaluation systems with which it was compared.
Methodology
Participants
A total of 119 high-performance athletes from various sports disciplines selected in a non-probabilistic manner participated in this study. A total of 112 men and 7 women were evaluated between January and March 2021. On the day of the evaluation, all the participants were apparently healthy and reported no history of injury. To avoid interference with the experiment, participants were advised not to consume alcohol or caffeinated beverages 24 hours before the test. All jumps were performed during a single training session in order to avoid variations due to the circadian cycle and/or any other confounding variables.
Ethics Statement
The study protocol followed the guidelines of ethical principles of the Declaration of Helsinki and the provisions of resolution 008430 of the Ministry of Health and Social Protection of Colombia. The objectives and risks of the study were explained before starting the evaluation protocol and were accepted by all the participants, who signed the informed consent autonomously. This study was accepted and endorsed by a legally constituted ethics committee according to national and international standards.
Procedure
This observational study consisted of repeated measurements of maximal jump height on subjects during a single testing session. Before the evaluation process, a 10-minute standardized warm-up was performed on a bicycle ergometer (BTL CardioPoint® CPET) with a power load of 80 W and a cadence of 70 to 75 rpm. Subsequently, neuromuscular activation was performed through short high-intensity movements (sprint, zigzag run, and multi-jump). Participants did 5 repetitions of sprints in 5 meters with 1 minute of rest, 5 repetitions of zigzag race in 10 meters, with the same rest time, and 4 series of 5 vertical multi-jumps with knee elevation with 1 minute of rest between each series.
Subjects were then instructed with familiarization jumps to achieve proper jumping technique with an emphasis on maintaining balance while falling. Subjects then performed 5 repetitions of countermovement jumps with a one-minute rest period between jumps. For a correct execution, the subjects placed their hands on their hips and bent their knees at a 90-degree angle and jumped to maximum height in a single movement. Knee angle was monitored in the sagittal plane by real-time video digitizing software.
The CMJ’s starting position was standing, torso straight, knees fully extended, feet shoulder-width apart. They were instructed to perform a fast downward movement and then a fast upward countermovement to jump as high as possible (Holsgaard Larsen et al., 2007).
The jump tests were performed using a Chronojump Boscosystem contact mat version 1.6.2 (Barcelona – Spain), in which near-perfect validity values (95% CI=.99-1.00; p <.001) (Pueo et al., 2020) were demonstrated; an OptoGait photoelectric system version 1.12 (Bolzano – Italy), which has described statistically significant validity values (95% CI=0.92-0.99; p <.001) (Lee et al., 2014); and My Jump 2 app, which authors have established to be a valid and reliable mobile app (p <.001, ICC=.997) (Balsalobre-Fernández et al., 2015a). All evaluations were performed simultaneously and the results were compared with the obtained values with the Wheeler Jump sensor (Figure 1).
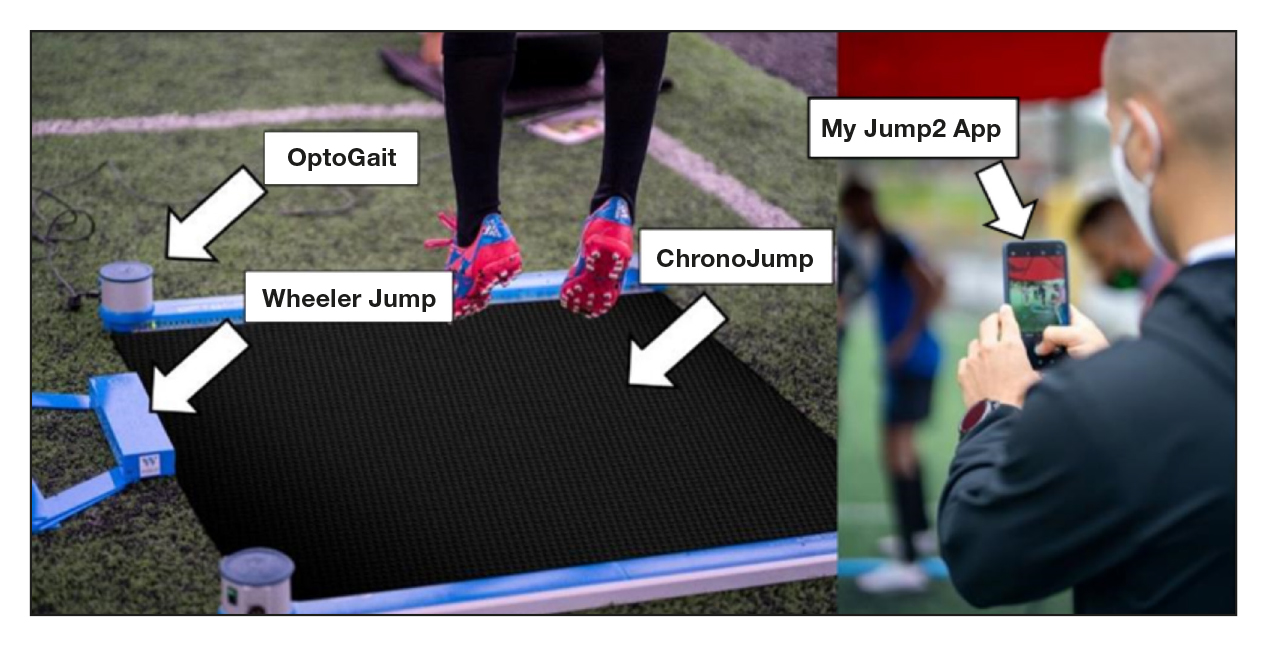
Note: assessment protocol with the four measuring instruments
The evaluation was carried out during a single day in the morning to guarantee that those evaluated had not had any type of training 18 hours before the evaluation. The terrain selected to locate the evaluation devices was always flat and without direct contact with the sun so as not to affect the data collection with the instruments used for the evaluation of the jump.
The location of the devices was first done by fixing the Chronojump Boscosystem jump platform to the ground. The OptoGait sensor and Wheeler Jump were placed around the jump platform, and to take the video with the My Jump 2 application, the evaluator stood in front of the athlete with a distance of approximately 2 meters to be able to accurately evaluate each jump.
Statistical analysis
The statistical analysis was performed using SPSS® version 25 and MedCal® version 19.1 software. The descriptive analysis of the data is presented through measures of central tendency, dispersion, and variability, given the quantitative nature of the variables. The normality of the data was determined through the Shapiro-Wilk test, due to the high statistical power of this test concerning other normality tests (Mohd Razali & Bee Wah, 2011); thus determining the nonparametric behavior of the obtained data in the present research (p <.05).
Given the non-normal distribution of the data, it was decided to perform a Passing and Bablok regression model (Bilić-Zulle, 2011) to determine the agreement between the Wheeler Jump photoelectric sensor with the comparison devices (OptoGait, Chronojump, and My Jump 2). Similarly, given the non-parametric distribution of the data, the reliability of the instrument was determined using the LIN correlation coefficient of concordance (CCC) (Camacho Sandoval, 2008), the interclass correlation coefficient (ICC), and the Smallest worthwhile change (SWC). Finally, concurrent validity was established with Spearman’s correlation coefficient determined from the Passing and Bablok model. All the aforementioned calculations will be accompanied by their respective 95% confidence intervals. Statistical significance was set at the p ≤.05 level.
Results
The total number of participants successfully complied with the protocol established for the assessment of strength through the CMJ, achieving the evaluation of a total of 119 athletes from different sports disciplines. The average age was 18.5 ± 1.3 years, highlighting that the average age of sports experience reported by the athletes was 11 years ± 2.4 years; an average weight of 67.36 ± 5.97 kg, an average height of 1.74 ± 0.056 m and an average body mass index of 22.11 ± 1.58 kg/m2 were determined, classifying this population according to the WHO as normal weight.
The average heights of the evaluated jumps with the different measurement instruments were: 39.3 ± 7.1 cm for Wheeler Jump, 42.83 ± 6.9 cm for My Jump 2, 40.26 ± 7.0 cm for Chronojump, and 40.19 ± 7.08 cm for OptoGait, observing a greater discrepancy in the evaluation between the Wheeler Jump sensor and the My Jump 2 app (Figure 2).
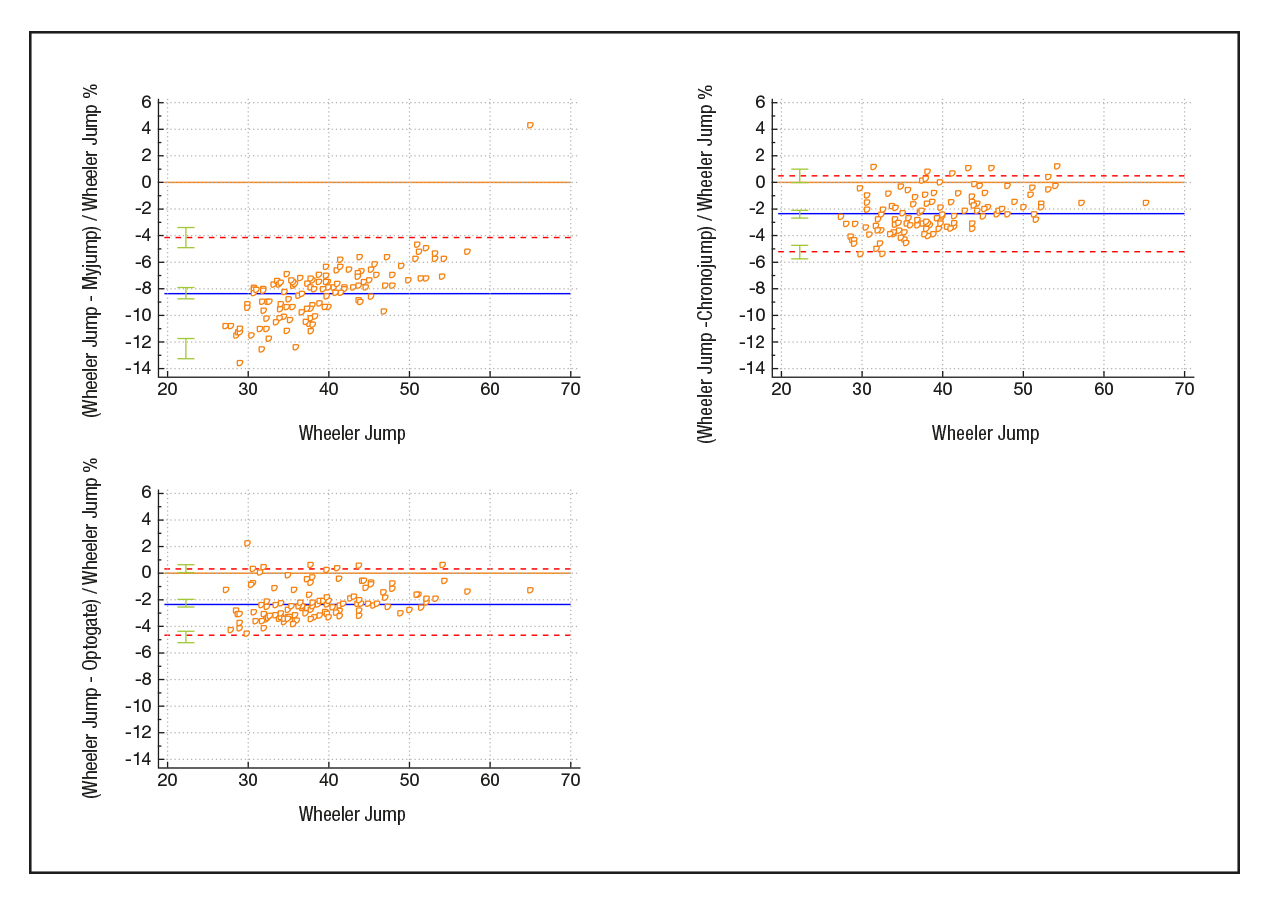
Note: This image shows the differences in measurement between the Wheeler Jump sensor and the other evaluation strategies.
The Smallest worthwhile change (SWC) was very homogeneous in the 4 measuring instruments, the SWC for the OptoGait was 1.41 centimeters, for the Chronojump it was 1.402 cm, for the My Jump 2 application it was 1.39 cm, and for Wheeler Jump it was 1.41 cm, thus determining that for the change in jump performance to be significant in any of the 4 instruments, it must be greater than 1.4 centimeters.
Figure 3 shows the different correlations measured from the Passing Bablok regression model between the Wheeler Jump and the different assessment methods, showing almost perfect positive correlations (Wheeler Jump vs My Jump 2 Rho=.994; Wheeler Jump vs OptoGait Rho=.997 and Wheeler Jump vs Chronojump Rho=.996).
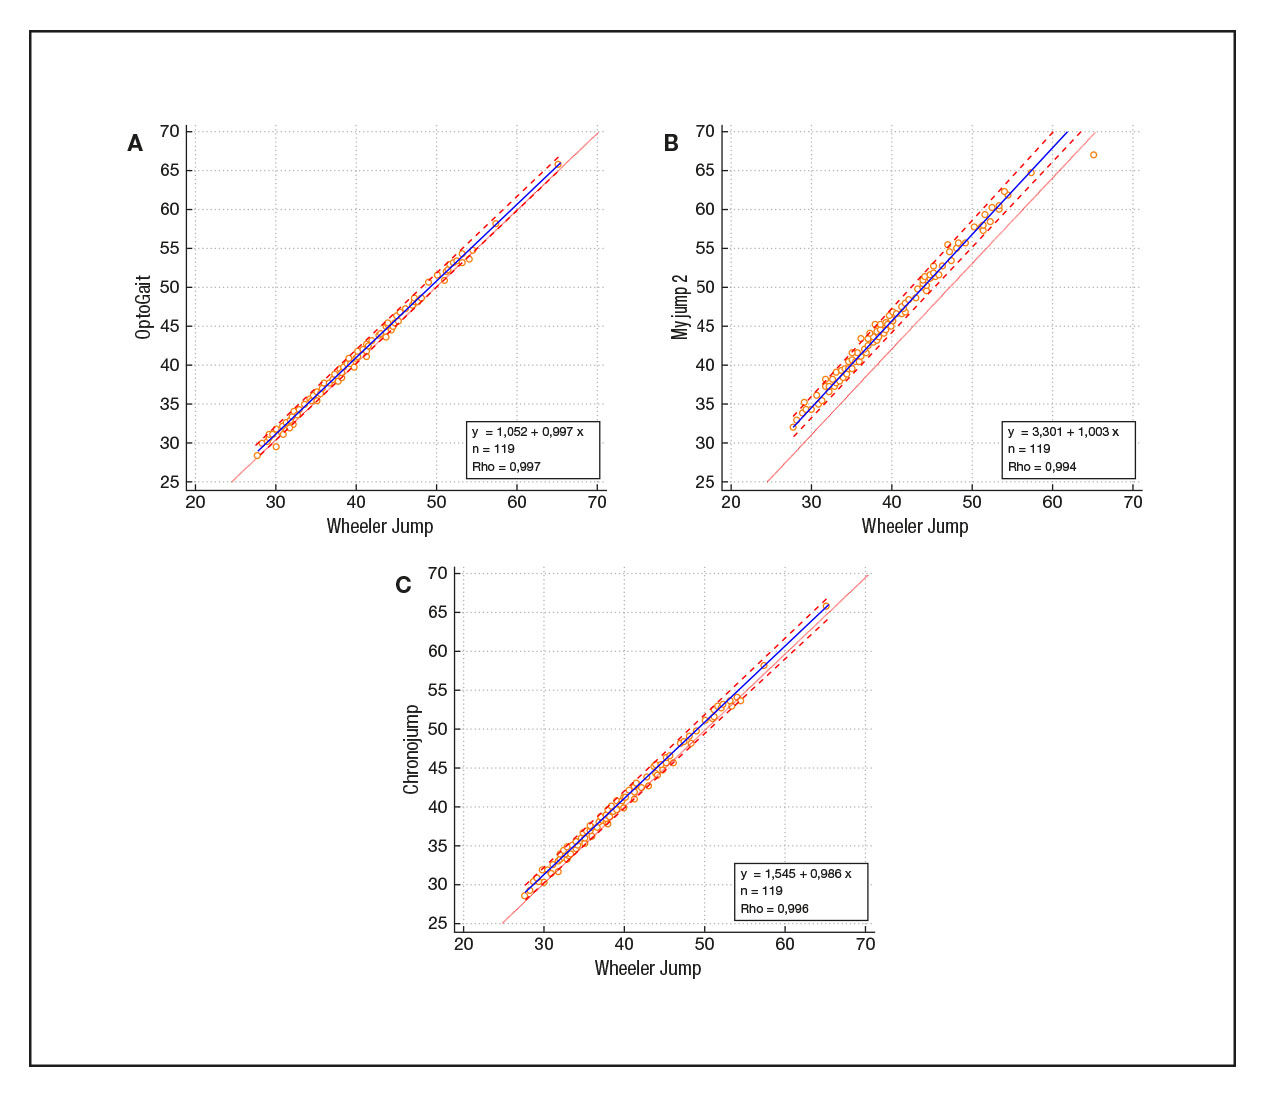
A. Passing Bablok regression analysis between OptoGait and Wheeler Jump; B. Passing Bablok regression analysis between My Jump 2 mobile app and Wheeler Jump; C. Passing Bablok regression analysis between Chronojump and Wheeler Jump. Contrast statistics: Spearman’s rho; n = sample; y = dependent variable; x = independent variable.
From the trend observed in the obtained data, it is valid to mention that the Wheeler Jump photoelectric sensor has obtained a high capacity to correctly predict the results that could be obtained with OptoGait, My Jump 2, and Chronojump; thus, giving it a high validity value.
Moreover, the coefficient of variation calculated by the logarithmic method for the Wheeler Jump sensor in the three established jumps by the assessment protocol was 1.5% (CI95% 1.39–1.80); subsequently, determining a standard error of measurement of 1.33cm, thus showing excellent levels of reliability and repeatability.
Table 1 shows the values obtained in each of the regression models applied in this study, revealing that, with the three instruments with which the Wheeler Jump sensor was compared, the intercept and the slope of the prediction formula are not statistically significant (due to their confidence interval), thus suggesting that there is a low probability of systematic error and/or proportional differences.

Finally, Lin’s Concordance Index was determined to evaluate the reproducibility and concordance between the sensor and the assessment methods used in this research. Considering the reference values established by Lin Li (Lin, 1989), a perfect concordance with OptoGait, a substantial concordance with Chronojump, and a poor concordance with the My Jump 2 app were observed.
Discussion
Vertical jump performance is considered a viable strategy for assessing the maximal explosive power of lower limbs in athletes under field conditions (Bosquet et al., 2009; Gutiérrez-Dávila et al., 2015; Ziv & Lidor, 2010).
To avoid the practical limitations involved in laboratory assessments, portable devices have been introduced to assess jumping performance from flight time (Balsalobre-Fernández et al., 2015b; Copoví Lanusse, 2015); however, despite the widespread use of these portable devices, few independent research studies have addressed the reliability and validity of these tools (Balsalobre-Fernández et al., 2015a; Lee et al., 2014; Pueo et al., 2020).
Therefore, the objective of this study was to determine the reliability and validity of the Wheeler Jump photoelectric sensor for measuring vertical jump height derived from flight time, compared to different scientifically validated assessment tools.
The results showed highly significant reliability and repeatability, and the correlation coefficients demonstrated almost perfect associations between the Wheeler Jump and the other assessment systems used in this study, thus confirming the working hypothesis.
The Passing and Bablok regression model verified that the systematic bias between the results of the different instruments was trivial. Furthermore, the lack of linear correlation shown in the multiple comparison plots (except for the My Jump 2 app) suggests that no differences are expected between the SD of the Wheeler Jump measurements with the Chronojump and OptoGait, demonstrating that the minimal bias between the methods is constant over the range of values; in this sense, the sensor concordance found from Lin’s index was perfect with OptoGait, substantial with ChronoJump, and poor with My Jump 2 app.
These findings partially coincide with those reported by Pueo et al. (2020) who determined the validation of the Chronojump, comparing the obtained data with strength platforms, finding strong concurrent validity and excellent test-retest reliability; however, these same authors report the occurrence of systematic biases between the two devices, a situation that differs from the data reported in this paper.
The differences found between the Wheeler Jump sensor was less than 1 cm compared to Chronojump and OptoGait; however, the difference in relation to the My Jump 2 mobile app was approximately 3.5 cm. This difference may be due to the quality of the camera on mobile devices, which makes it difficult to accurately select the moment of takeoff during the execution of the jump or the expertise in using the mobile application. In this sense, previous studies that compared instruments that evaluate jump performance through time of flight with alternative laboratory-based methods yielded higher magnitudes of error. Contact mats have been reported to overestimate jump height with regard to force platforms in the range of approximately 1.7 cm for SquatJump (SJ) (Kenny et al., 2012), and 2.8 for CMJ (Enoksen et al., 2009). Such an overestimation is probably due to a minimal force required to activate the mechanical circuitry of the mats. Considering the above, wider discrepancies have been found, as is the case of the photocells, which have shown a large systematic bias, varying from 14.49 to 11.08 cm for the SJ with the force platforms despite having high values, reliability and repeatability values (Attia et al., 2017).
Practical Applications
The data presented in this study have demonstrated that the Wheeler Jump sensor is a reliable and valid tool for the evaluation of the CMJ on field conditions, establishing that the findings can be interchangeable with the OptoGait and the Chronojump. Athletes, coaches, and researchers can rely on the use of this technology to assess and monitor vertical jump performance; therefore, we can conclude that this is a reliable tool that provides practitioners and researchers with accurate information regarding changes in athlete’s physical performance at a fraction of the value of alternative patented systems.
Acknowledgements
The authors would like to thank all the athletes participating in the study; without them this would not have been possible.
Likewise, the authors would like to thank all the sports leagues and teams that facilitated access to athletes and facilitated the development of the research work.
References
[1] Attia, A., Dhahbi, W., Chaouachi, A., Padulo, J., Wong, D. P., & Chamari, K. (2017). Measurement errors when estimating the vertical jump height with flight time using photocell devices: The example of Optojump. Biology of Sport, 34(1), 63–70. https://doi.org/10.5114/biolsport.2017.63735
[2] Balsalobre-Fernández, C., Glaister, M., & Lockey, R. A. (2015a). The validity and reliability of an iPhone app for measuring vertical jump performance. Journal of Sports Sciences, 33(15), 1574–1579. https://doi.org/10.1080/02640414.2014.996184
[3] Balsalobre-Fernández, C., Nevado-Garrosa, F., Del Campo-Vecino, J., & Ganancias-Gómez, P. (2015b). Repeated Sprints and Vertical Jumps in Young Elite Soccer and Basketball Players. Apunts Educación Física y Deportes, 120, 52–57. https://doi.org/10.5672/apunts.2014-0983.es.(2015/2).120.07
[4] Bilić-Zulle, L. (2011). Comparison of methods: Passing and Bablok regression. In Biochemia Medica (Vol. 21, Issue 1, pp. 49–52). Biochemia Medica, Editorial Office. https://doi.org/10.11613/bm.2011.010
[5] Bosco, C., Komi, P. V., Tihanyi, J., Fekete, G., & Apor, P. (1983a). Mechanical power test and fiber composition of human leg extensor muscles. European Journal of Applied Physiology and Occupational Physiology, 51(1), 129–135. https://doi.org/10.1007/BF00952545
[6] Bosco, C., Luhtanen, P., & Komi, P. (1983b). A simple method for measurement of mechanical power in jumping. European Journal of Applied Physiology and Occupational Physiology, 50(2), 273–282. https://doi.org/10.1007/BF00422166
[7] Bosquet, L., Berryman, N., & Dupuy, O. (2009). A comparison of 2 optical timing systems designed to measure flight time and contact time during jumping and hopping. Journal of Strength and Conditioning Research / National Strength & Conditioning Association, 23(9), 2660–2665. https://doi.org/10.1519/JSC.0b013e3181b1f4ff
[8] Camacho Sandoval, J. (2008). Coeficiente de concordancia para variables continuas. Acta Médica Costarricense, 52(6), 211–212. https://doi.org/10.51481/amc.v52i6.5
[9] Copoví Lanusse, R. (2015). Analysis of Plyometric Training Volume on Vertical Jump Height Performance. Apunts Educación Física y Deportes, 120, 43–51. https://doi.org/10.5672/apunts.2014-0983.es.(2015/2).120.06
[10] De Blas, X., Padullés, J. M., Del Amo, J. L. L., & Guerra-Balic, M. (2012). Creación y validación de Chronojump-Boscosystem: un instrumento libre para la medición de saltos verticales. RICYDE: Revista Internacional de Ciencias Del Deporte, 8(30), 334–356. https://doi.org/10.5232/ricyde2012.03004
[11] Enoksen, E., Tønnessen, E., & Shalfawi, S. (2009). Validity and reliability of the Newtest Powertimer 300-series® testing system. Journal of Sports Sciences, 27(1), 77–84. https://doi.org/10.1080/02640410802448723
[12] Gallardo-Fuentes, F., Gallardo-Fuentes, J., Ramírez-Campillo, R., Balsalobre-Fernández, C., Martínez, C., Caniuqueo, A., Cañas, R., Banzer, W., Loturco, I., Nakamura, F. Y., & Izquierdo, M. (2016). Intersession and intrasession reliability and validity of the My Jump App for measuring different jump actions in trained male and female athletes. Journal of Strength and Conditioning Research, 30(7), 2049–2056.https://doi.org/10.1519/JSC.0000000000001304
[13] García-López, D., Herrero-Alonso, J., & De Paz-Fernandez, J. (2003). Metodología del entrenamiento pliométrico. Revista Internacional de Medicina y Ciencias de la Actividad Física y el Deporte, 3(12), 190–204.
[14] Garrido-Chamorro, R. P., & González-Lorenzo, M. (2004). Test de Bosco: Evaluación de la potencia anaeróbica de 765 deportistas de alto nivel. Lecturas: Educación Física y Deportes, 10(78), 15.
[15] Gutiérrez-Dávila, M., Giles-Girela, F. J., González-Ropero, C., Gallardo-Román, D. J., & Rojas-Ruiz, F. J. (2015). Effect on the Intensity of Countermovement on Vertical Jump Performance. Apunts Educación Física y Deportes, 119, 87–96. https://doi.org/10.5672/apunts.2014-0983.es.(2015/1).119.06
[16] Harman, E. A., Rosenstein, M. T., Frykman, P. N., Rosenstein, R. M., & Kraemer, W. J. (1991). Estimation of human power output from vertical jump. Journal of Strength and Conditioning Research, 5(3), 116–120. https://doi.org/10.1519/00124278-199108000-00002
[17] Holsgaard Larsen, A., Caserotti, P., Puggaard, L., & Aagaard, P. (2007). Reproducibility and relationship of single-joint strength vs multi-joint strength and power in aging individuals. Scandinavian Journal of Medicine and Science in Sports, 17(1), 43–53. https://doi.org/10.1111/j.1600-0838.2006.00560.x
[18] Kenny, I. C., Cairealláin, A. O., & Comyns, T. M. (2012). Validation of an electronic jump mat to assess stretch-shortening cycle function.Journal of Strength and Conditioning Research, 26(6), 1601–1608. https://doi.org/10.1519/JSC.0b013e318234ebb8
[19] Lee, M. M., Song, C. H., Lee, K. J., Jung, S. W., Shin, D. C., & Shin, S. H. (2014). Concurrent validity and test-retest reliability of the OPTOGait photoelectric cell system for the assessment of spatio-temporal parameters of the gait of young adults. Journal of Physical Therapy Science, 26(1), 81–85. https://doi.org/10.1589/jpts.26.81
[20] Lin L. I.-K. (1989). A Concordance Correlation Coefficient to Evaluate Reproducibility. Biometrics. 1989;45(1):255.
[21] Mohd Razali, N., & Bee Wah, Y. (2011). Power comparisons of Shapiro-Wilk, Kolmogorov-Smirnov, Lilliefors and Anderson-Darling tests. Journal of Statistical Modeling and Analytics, 2(1), 21–33.
[22] Montalvo, S., Gonzalez, M. P., Dietze-Hermosa, M. S., Eggleston, J. D., & Dorgo, S. (2021). Common Vertical Jump and Reactive Strength Index Measuring Devices: A Validity and Reliability Analysis. Journal of Strength and Conditioning Research, 35(5), 1234–1243. https://doi.org/10.1519/JSC.0000000000003988
[23] Pueo, B., Penichet-Tomas, A., & Jimenez-Olmedo, J. M. (2020). Reliability and validity of the Chronojump open-source jump mat system. Biology of Sport, 37(3), 255–259. https://doi.org/10.5114/biolsport.2020.95636
[24] Tejada, C., & Suarez, G. (2013). Correlación entre la potencia en miembros inferiores (altura de despegue del salto) medida con protocolo de Bosco y la velocidad frecuencial (medida con el test de 30 y 60 metros planos) de la selección Colombia femenina y masculina de ultimate frisbee. Revista de Educación Física, 2(1), 147–162.
[25] Ziv, G., & Lidor, R. (2010). Vertical jump in female and male basketball players-A review of observational and experimental studies. In Journal of Science and Medicine in Sport (Vol. 13, Issue 3, pp. 332–339). Elsevier.
ISSN: 2014-0983
Received: September 24, 2021
Accepted: February 21, 2022
Published: July 1, 2022
Editor: © Generalitat de Catalunya Departament de la Presidència Institut Nacional d’Educació Física de Catalunya (INEFC)
© Copyright Generalitat de Catalunya (INEFC). This article is available from url https://www.revista-apunts.com/. This work is licensed under a Creative Commons Attribution-NonCommercial-NoDerivatives 4.0 International License. The images or other third party material in this article are included in the article’s Creative Commons license, unless indicated otherwise in the credit line; if the material is not included under the Creative Commons license, users will need to obtain permission from the license holder to reproduce the material. To view a copy of this license, visit https://creativecommons.org/licenses/by-nc-nd/4.0/deed.en


