Relationship Between Jump Capacity and Performance in BMX Cycling
Pau Robert
Rafel Cirer-Sastre

Isaac López-Laval
Sergi Matas-García
Jesús Álvarez-Herms
Sonia Julià-Sánchez
Francisco Corbi
*Corresponding author: Francisco Corbi fcorbi@inefc.es
Cite this article
Robert, P., Cirer-Sastre, R., López-Laval, I., Matas-García, S., Álvarez-Herms, J., Julià-Sánchez, S., & Corbi, F. (2020). Relationship Between Jump Capacity and Performance in BMX Cycling. Apunts. Educación Física y Deportes, 140, 37-43. https://doi.org/10.5672/apunts.2014-0983.es.(2020/2).140.06
Abstract
The objective of this study is to assess the relationship between the results obtained on different vertical jump tests and the top score recorded during a BMX (Bicycle Moto-Cross) test and the rider’s performance. To do so, 10 BMX pilots participated in this study; 5 regarded as the élite group (EG) (age: 18.8 ± 3.7, weight: 68.4 ± 8.5 kg, height: 174 ± 9 cm and previous BMX experience: 8 ± 3.8 years) and 5 regarded as the recreational group (RG) (age: 19.8 ± 4.8, weight: 69.2 ± 11.7 kg, height: 170 ± 9 cm, previous BMX experience: 4.2 ± 1.3 years). Vertical jump capacity was obtained using the Bosco protocol, i.e. vertical squat jump (SJ), vertical countermovement jump (CMJ), drop jump (DJ) and repetitive jump (RJ), and time in race in a BMX circuit was determined. The results indicate a direct relationship between the time used to complete the circuit and the height of the jump reached in SJ (r: –.801; p: .017), CMJ (r : –.798; p : .018) and DJ (r : –.782; p: .022). This all suggests that assessing jump capacity using the Bosco test may be a useful tool for assessing BMX performance.
Introduction
Bicycle Motor-Cross (BMX), an Olympic sport since Beijing 2008, is a sports speciality in which a group of eight riders compete against each other in a circuit of variable length (200-400 m). The first rider to cross the finish line wins the race or the heat (Rylands et al., 2013). The competitions consist of four classifying heats in which the four fastest riders qualify for the next race, with this competition format producing the final race with the best riders from the four previous rounds. The recovery period between heats is 30 minutes, as established by the rules (Mateo et al., 2011).
Based on the length of the competitions, between 30 and 45 seconds, and the type of force made, maximum intensity, BMX is considered an endurance sport with explosive strength (Zabala et al., 2009). The characteristics of the courses and their layout on a slope mean that the capacity to accelerate on the bicycle, which requires high levels of strength, is essential in the first few metres of the race (Cowell et al., 2012; Mateo et al., 2011) and that the technical complexity to adapt to each part of the circuit is very high (Cowell et al., 2012). On the other hand, it has been suggested that the initial acceleration reached by the rider has a huge impact on the outcome of the competition (Herman et al., 2009). This would all seem to indicate that the metabolic demands are oriented towards anaerobic glycolysis and phosphagens (Zabala et al., 2008), with lactic acid concentrations of the blood recorded at around 8 mmol/l on average, with maximum values of 18.6 mmol/l (Louis et al., 2013; Zabala et al., 2009). Furthermore, anaerobic glycolysis plays a crucial role in the need to repeat high-intensity efforts both in the same heat and between heats, vastly determining the rider’s recovery capacity (Louis et al., 2013).
Similarly, in this individual sport, individualisation of the training load is essential in monitoring fatigue, controlling adaptations and optimising performance (Capostagno et al., 2014). To do so, periodic physical assessments can determine the athlete’s fitness and minimise the risk of injury (Lamberts et al., 2010). The selection of a battery of tests to assess different performance parameters is essential and depends on a range of factors, such as the duration of the effort to be analysed, the intensity at which this sports speciality is performed, the type of muscles involved in the movement patterns and the time in the season when they are done.
In this regard, a variety of tests have been used to assess BMX performance, both in the lab and on the competition circuit. Of them, the assessment of jump capacity stands out on account of its high reliability, specificity and low cost, and it is used as a way of assessing rider performance at different competitive levels (professional and amateur (Babault et al., 2018) and in new riders (Ramírez-Vélez et al., 2017) or masters (Del Vecchio et al., 2017). Although the use of jump tests as a methodology to evaluate the performance of BMX riders is widely accepted (Bertucci & Hourde, 2011), the level of association between these tests and competition performance has been viewed differently depending on the type of test, the distance ridden and the athlete’s level. For example, Babault et al. (2018) found no correlations between the maximum height reached in a vertical countermovement jump (CMJ) and the amount of time taken to complete a timed circuit (r: –.25; p: .55), while Paquet et al. (2006) found that the maximum power generated in a jump test could explain 60% of the mean power generated in the Wingate test. Despite these results, there are no studies which have analysed the relationships between the results in different kinds of jumps and the best score recorded in a circuit.
For all these reasons, the main objective of this study is to assess the degree of association between the results in different kinds of vertical jumps and the best score recorded during a BMX race according to the type of rider.
Methodology
Participants
A total of 10 BMX pilots participated in this study; 5 regarded as the élite group (EG) (age: 18.8 ± 3.7, weight: 68.4 ± 8.5 kg, height: 174 ± 9 cm and previous BMX experience: 8 ± 3.7 years) and 5 regarded as the recreational group (RG) (age: 19.8 ± 4.8 years, weight: 69.2 ± 11.7 kg, height: 170 ± 9 cm and previous BMX experience: 4.2 ± 1.3 years) (Table 1).

Table 1
Descriptive characteristics of the study participants
The inclusion criteria for assembling the sample were: 1) for the EG: 1.a) be in the top 20 in the 2018 world ranking (published by the International Cycling Federation); 1.b) not have had an injury in the previous six months that could affect data collection; 1.c) have at least two years’ experience of strength work under the supervision of a physical trainer. 2) For the RG, the inclusion criteria were: 2.a) have competed in at least three national races in the current year, 2.b) not have had an injury in the previous six months that could affect data collection; 2.c) have done strength work independently in the previous year. The exclusion criteria for both groups were: A) have had surgery in the 12 months prior to the tests, and B) have any pain in the lower extremities or the trunk at the time of the study.
All the participants were informed of the objectives of this study verbally and in writing, as well as about the data collection procedures, in addition to the benefits and possible risks stemming from their participation. This study was designed following the ethical recommendations made by Harriss and Atkinson (2015) and in accordance with the latest version of the Helsinki Declaration (World Medical Association, 2013). The study protocol was approved by the Ethics Committee of Aragon (ref. no. 07/2019).
Experimental process
The data were collected in two different recording sessions with at least 48 hours between them, and blindly by a researcher who did not know the participants beforehand, and none of whom had made a maximum effort in the 24 hours prior to the tests.
In the first session, the participants completed an individual questionnaire which collected personal information on the number of years they had been participating in BMX, any injuries they had had in the past and their competition results. The participants were weighed on a scale and their height was measured with a height rod by the SECA© brand (1-mm precision for height and 0.1 kg for weight). Subsequently, they all engaged in a standard warm-up consisting in pedalling on a cycloergometer for 10 minutes at 50 rpm and an intensity of between 50%-63% of maximum heart rate (McGowan et al., 2015; Yang et al., 2017). The vertical jump protocol described by Bosco et al. (1983) was then administered; it consists of 3 repetitions for each of the tests: SJ, CMJ and DJ (from a height of 40 cm) and one for the repetitive jump test (RJ) for 30 seconds. The recovery between each of the repetitions of each test and between the different tests was 3 and 5 minutes, respectively. Furthermore, the mean height of the 3 attempts (SJ, CMJ and DJ) was determined. To calculate the Fatigue Index (FI), the mean of the first four jumps (Hmean_4) and last four jumps (Hmean_end4j) in the RJ test were obtained and the following equation was applied:
FI:[(Hmean_4- Hmean_end4j)/ Hmean_4]*100 (Čular et al., 2018).
The Elasticity Index (EI) was calculated using the following equation:
EI:[(CMJ jump height – SJ jump height)]*100 (Bosco et al., 1983).
All the participants were verbally encouraged with the intention of producing their best result, and the different kinds of jumps were randomised with the exception of the RJ, which was executed last in order to prevent cumulative fatigue from influencing the other variables.
In the second assessment session, the best score on the BMX circuit at the Bike Park of Vila-sana in Lleida (E) (Figure 1) was recorded. This circuit is 400 metres long with an 8-metre starting ramp, and it was officially approved by the International Cycling Union (UCI) in 2009. All the participants were familiar with the route and had already trained or competed on it several times. A warm-up was done before the race times were taken, consisting of pedalling for 5 minutes on the circuit at a pace of 50%-60% of maximum perceived intensity. Afterwards, 2 complete circuits were done at an intensity of 80%-90% of maximum perceived intensity. A recovery time of 5 minutes between the warm-up sets was given, and the in-race time at 100% was subsequently recorded for each rider individually. Before the assessments, all the participants were asked not to eat or drink anything 90 minutes prior to the start of the test. No physical exertion was allowed in the 24 hours before the data were collected.

Data collection
To assess the amount of time taken for the test, 2 electric eyes by the ARTEK® PNP brand (Proyectos de Iluminación Técnica Avanzada, SL, Spain) were used (response time <0.5 ms at 1 kHz), which were installed at the circuit’s start and finish line. In order to avoid unintentionally activating them, the height of the first electric eye (starting line) was adjusted to be activated once the start gate opened, while the second electric eye was placed at the height of the axis of rotation of the front wheel. The entire closed measurement system was synchronised using a Voice Box System time control system and starting lights by the Daktronics® brand (Zabala et al., 2009).
Jump capacity was assessed using a contact platform by the Chronojump Boscosystem® brand (29.6 x 21 cm), connected serially to a Chronopic electronic microcontroller. The data were collected on the Chronojump 1.8.1 software. Both tools had previously been validated by De Blas et al. (2012).
Statistical analysis
First of all, the assumptions of normality were verified by plotting histograms and by means of the Shapiro-Wilks test. The mean, standard deviation and range [min.–max.] were then calculated for each of the variables analysed. The prediction intervals were calculated with a confidence of 95% and the differences between groups were evaluated using the t-test comparison of simple measures. The correlations between each rider’s score and the value obtained in each of the jump tests were calculated with the Pearson correlation coefficient. In all tests, results were considered statistically significant when p <.05. All the analyses were performed in R (R Development Core Team, 2008).
Results
No significant differences were found between the participants’ age, weight or height. However, the number of years of previous BMX experience was significantly lower in the RG compared to the EG (95% CI : [–10.41, –1.59]; t(4): –3.67; p: .019).
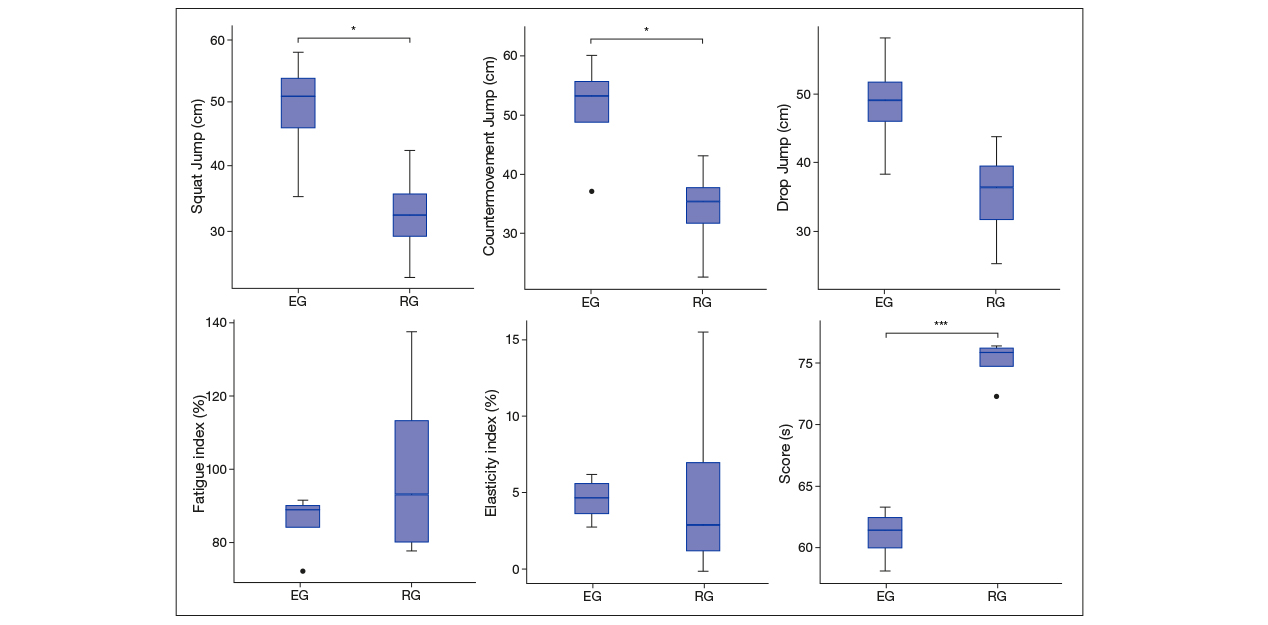
With regard to the different kinds of jumps, the RG reached significantly lower heights than the EG with a difference of 95% CI: [-31.83, –0.84] cm (t(6): –2.6; p: .042) in the SJ. Similarly, the CMJ was significantly lower in the RG (95% CI: [–32.65, –0.90] cm; t(6): –2.6; p: .041), while race time for the was RG longer, that is, more seconds (95% CI: [10.39, 17.65]; t(6): 9.52; p < .001). Furthermore, no significant differences were found between groups for the DJ (t(6): 9.52; p: .06), Fatigue Index in the RJ (t(4): 1.04; p: .364) and Elasticity Index (t(4): 0.20; p: .852) variables. A comparison of the different values analysed can be found in Table 2 and Figure 2.
Table 2
Comparison between groups for the different analysis variables
The relationship between the different jump variables, the race times and rider level are described in Table 3. The race time correlated negatively with the values obtained in the SJ (R2Adjusted: 0.58; F(1.6): 10.76; p: .017), the CMJ (R2Adjusted: 0.58; F(1.6): 10.52. p: .018) and the DJ (R2Adjusted: 0.55. F(1.6): 9.44; p: .022). Conversely, no jump test showed a significant interaction between rider levels (RG or EG). Furthermore, neither the FI or EI showed significant associations with either race time or rider level.
Table 3
Correlation table between race time, jump test and group
Discussion
This is the first study that seeks to examine the relationships between the performance values obtained in different jump tests and the top score recorded in a BMX race according to rider level. The results of this study reveal the existence of an indirect relationship between the time taken to complete the circuit and the jump height reached in the SJ (r: –.801; p: .017), the CMJ (r: –.798; p: .018) and the DJ (r: –.782; p: .022), which suggests that developing different power contents in specific training of concentric capacity (SJ), explosive elasticity (CMJ) and explosive elastic reflex (DJ) may bear a direct relationship with race times. These results tally with those reported by Bertucci et al. (2007), who found a statistically significant relationship between the height reached in these jumps (SJ and CMJ) and the amount of time needed to complete different parts of the circuit. This all suggests that jump tests could be a predictive tool of performance in BMX in certain distances and circuits with similar characteristics to the one used in this study.
On the other hand, no statistically significant relationships were found between EI, FI and the best score on the circuit, a result which could be attributed to several reasons. First, it is possible that the stretch-shortening cycle (SSC) which occurs during a BMX race is of a lesser magnitude and takes place much more slowly than in other types of situations, like in plyometric training. This would generate a lower level of force during the concentric phase of motion, since a direct relationship has been found between a lower duration of the isometric stabilisation phase (transition between the eccentric and concentric phase) and stronger impulsion during the concentric phase (Wilson et al., 1991). On the other hand, the joint positions adopted during the different specific technical patterns made throughout the test (pedalling, jumping and pumping), the scant variability in the working angles (between 0% and 5%) and the major role played by the arms in reducing the vertical impulsion generated could lead to a lower involvement of the elastic structures during the tests (Cowell et al., 2012; Doré et al., 2006). Furthermore, the performance obtained in the first few metres of the race seemed to condition the end result enormously (Cowell et al., 2012; Rylands & Roberts, 2014).
Based on the data obtained in this study, we suggest the use of tests in BMX that allow information to be obtained about the rider’s FI, since the use of relative values ignores important factors like the absolute force produced. These factors are fundamental in the first few metres of the race, when the riders have to overcome inertia and achieve the maximum acceleration possible. Theodorou et al. (2013) reported a significant correlation between the absolute values obtained in 30-second vertical jump tests and the anaerobic power developed in the Wingate pedalling test.
Several limitations of this study should be borne in mind, the first being the sample size analysed. Although the sample in this study was small, the high proficiency of the EG riders, along with the need for the RG to match the rest of the sample analysed, contributed to a smaller sample size. On the other hand, no partial times were taken for each part of the circuit, which could have improved the sensitivity of the variables chosen. Furthermore, different types of circuits should be studied in order to detect the force profiles for each of them, and future studies which analyse larger samples of riders on a greater number of circuits are therefore needed.
Conclusions
The results of this study suggest that there is a direct relationship between the best score obtained in BMX and jumping capacity in the SJ, CMJ and DJ tests. The absolute values in jump height for the SJ, CMJ and DJ were higher in the EG. No significant differences were found for the EI and FI variables, despite the fact that the absolute values of the EG were higher than those of the RG.
References
[1] Babault, N., Poisson, M., Cimadoro, G., Cometti, C., & Païzis, C. (2018). Performance determinants of fixed gear cycling during criteriums. European Journal of Sport Science, 18(9), 1199-1207. doi.org/10.1080/17461391.2018.1484177
[2] Barbany, J. R. (2018). Fisiología del ejercicio físico y del entrenamiento (2.a ed.). Paidotribo.
[3] Bertucci, W., & Hourde, C. (2011). Laboratory testing and field performance in BMX riders. Journal of Sports Science and Medicine,10(2), 417-419.
[4] Bertucci, W., Hourde, C., Manolova, A., & Vettoretti, F. (2007). Facteurs mécaniques de la performance lors de la phase d’accélération en BMX chez des pilotes entraînés. Science and Sports, 22(3-4), 179-181. doi.org/10.1016/j.scispo.2007.04.003
[5] Bosco, C., Luhtanen, P., & Komi, P. V. (1983). A simple method for measurement of mechanical power in jumping. European Journal of Applied Physiology and Occupational Physiology, 50(2), 273-282. doi.org/10.1007/BF00422166
[6] Capostagno, B., Lambert, M., & Lamberts, R. (2014). Standardized versus customized high-intensity training: Effects on cycling performance. International Journal of Sports Physiology and Performance, 9(2), 292-301. doi.org/10.1123/IJSPP.2012-0389
[7] Cowell, J., McGuigan, M., & Cronin, J. (2012). Movement and skill analysis of supercross bicycle motocross. Journal of Strength and Conditioning Research, 26(6), 1668-1694. doi.org/10.1519/JSC.0b013e318234eb22
[8] Čular, D., Ivančev, V., Zagatto, A. M., Milić, M., Beslija, T., Sellami, M., & Padulo, J. (2018). Validity and reliability of the 30-s continuous jump for anaerobic power and capacity assessment in combat sport. Frontiers in Physiology, 9, 543. doi.org/10.3389/fphys.2018.00543
[9] De Blas, X., Padullés, J. M., Del Amo, J. L. L., & Guerra-Balic, M. (2012). Creación y validación de Chronojump-Boscosystem: un instrumento libre para la medición de saltos verticales. RICYDE: Revista Internacional de Ciencias del Deporte, 8(30), 334-356. doi.org/10.5232/ricyde2012.03004
[10] Del Vecchio, L., Stanton, R., Reaburn, P., Macgregor, C., Meerkin, J., Villegas, J., & Korhonen, M. T. (2017). Effects of combined strength and sprint training on lean mass, strength, power and sprint performance in masters road cyclists. Journal of Strength and Conditioning Research, 33(1), 66-79. doi.org/10.1519/JSC.0000000000001960
[11] Doré, E., Baker, J. S., Jammes, A., Graham, M., New, K., & Van Praagh, E. (2006). Upper body contribution during leg cycling peak power in teenage boys and girls. Research in Sports Medicine, 14(4), 245-257. doi.org/10.1080/15438620600985829
[12] Harriss, D. J., & Atkinson, G. (2015). Ethical standards in sport and exercise science research: 2016 update. International Journal of Sports Medicine, 36(14), 1121-1124. doi.org/10.1055/s-0035-1565186
[13] Herman, C., Mcgregor, S., Hunter, A., & Bollt, E. (2009). Power capabilities of elite bicycle motocross (BMX) racers during field testing in preparation for 2008 olympics. Medicine & Science in Sports & Exercise, 45(5), 306-307. doi.org/10.1249/01.mss.0000355486.69033.ab
[14] Lamberts, R. P., Rietjens, G. J., Tijdink, H. H., Noakes, T. D., & Lambert, M. I. (2010). Measuring submaximal performance parameters to monitor fatigue and predict cycling performance: A case study of a world-class cyclo-cross cyclist. European Journal of Applied Physiology, 108 (1), 183-190. doi.org/10.1007/s00421-009-1291-3
[15] Louis, J., Billaut, F., Bernard, T., Vettoretti, F., Hausswirth, C., & Brisswalter, J. (2013). Physiological demands of a simulated BMX competition. International Journal of Sports Medicine, 34 (6), 491-496. doi.org/10.1055/s-0032-1327657
[16] Mateo, M., Blasco-Lafarga, C., & Zabala, M. (2011). Pedaling power and speed production vs. technical factors and track difficulty in bicycle motocross cycling. Journal of Strength and Conditioning Research, 25 (12), 3248-56. doi.org/10.1519/JSC.0b013e3181f90847
[17] McGowan, C., Pyne, D., Thompson, K., & Rattray, B. (2015). Warmup strategies for sport and exercise: Mechanisms and applications. Sports Medicine, 45 (11), 1523-46. doi.org/10.1007/s40279-015-0376-x
[18] Paquet, Y., Bertucci, W., & Hourde, C. (2006). Influence de variables psychologiques sur la performance au test de Wingate chez des pilotes de BMX. Science and Sports, 21 (5), 297-299. doi.org/10.1016/j.scispo.2006.06.008
[19] R Development Core Team. (2008). R: A language and environment for statistical computing. (R Foundation for Statistical Computing, Ed.) (1.a ed., Vol. 2). R Foundation for Statistical Computing.
[20] Ramírez-Vélez, R., García-Hermoso, A., Agostinis-Sobrinho, C., Mota, J., Santos, R., Correa-Bautista, J. E., Amaya-Tambo, D. C., & Villa-González, E. (2017). Cycling to school and body composition, physical fitness, and metabolic syndrome in children and adolescents. Journal of Pediatrics, 9 (18), 57-63. doi.org/10.1016/j.jpeds.2017.05.065
[21] Rylands, L., Roberts, S., Cheetham, M., & Baker, A. (2013). Velocity produktion in elite BMX riders: A field based study usiing a SRM power meter. Journal of Exercise Physiology, 16 (3), 40-50.
[22] Rylands, L., & Roberts, S. J. (2014). Relationship between starting and finishing position in World Cup BMX racing. International Journal of Performance Analysis in Sport, 14 (1), 14-23. doi.org/10.1080/24748668.2014.11868699
[23] Theodorou, A., Paradisis, G., Panoutsakopoulos, V., Smpokos, E., Skordilis, E., & Cooke, C. (2013). Performance indices selection for assessing anaerobic power during a 30 second vertical jump test. The Journal of Sports Medicine and Physical Fitness, 53 (6),596-603
[24] Wilson, G. J., Wood, G. A., & Elliott, B. C. (1991). Optimal stiffness of series elastic component in a stretch-shorten cycle activity. Journal of Applied Physiology, 70 (2), 825-833. doi.org/10.1152/jappl.1991.70.2.825
[25] World Medical Association. (2013). World Medical Association Declaration of Helsinki. Ethical principles for medical research involving human subjects. Journal of American Medical Association, 310 (20), 2191-2194. doi.org/10.1001/jama.2013.281053
[26] Yang, W., Liu, C., & Shiang, T. (2017). Warm-up effects from concomitant use of vibration and static stretching after cycling. The Journal of Sports Medicine and Physical Fitness, 57(4), 362-368. doi.org/10.23736/S0022-4707.16.06115-X
[27] Zabala, M., Requena, B., Sanchez-Muñoz, C., González-Badillo, J. J., García, I., Ööpik, V., & Páásuke, M. (2008). Effects of sodium bicarbonate ingestion on performance and perceptual responses in a laboratory-simulated BMX cycling qualification series. Journal of Strength and Conditioning Research, 22(5), 1645-1653. doi.org/10.1519/JSC.0b013e318181febe
[28] Zabala, M., Sánchez-Muñoz, C., & Mateo, M. (2009). Effects of the administration of feedback on performance of the BMX cycling gate start. Journal of Sports Science and Medicine, 8(3), 393-400.
ISSN: 2014-0983
Received: 12 de abril de 2019
Accepted: 3 de julio de 2019
Published: 1 de abril de 2020
Editor: © Generalitat de Catalunya Departament de la Presidència Institut Nacional d’Educació Física de Catalunya (INEFC)
© Copyright Generalitat de Catalunya (INEFC). This article is available from url https://www.revista-apunts.com/. This work is licensed under a Creative Commons Attribution-NonCommercial-NoDerivatives 4.0 International License. The images or other third party material in this article are included in the article’s Creative Commons license, unless indicated otherwise in the credit line; if the material is not included under the Creative Commons license, users will need to obtain permission from the license holder to reproduce the material. To view a copy of this license, visit https://creativecommons.org/licenses/by-nc-nd/4.0/deed.en


