Anthropometry, Tactical Position, Performance Parameters and Experience in Water Polo: Network Analysis
Dieisson M. Vasques
Guilherme Tucher
Camila D. de Castro
Diego A. Paixão
Paulo F. Bandeira
Flávio A. de S. Castro
*Corresponding author: Dieisson M. Vasques dieissonvasques@gmail.com
Cite this article
Vasques, D. M., Tucher G., De Castro, C. D., Paixão D. A., Bandeira, P. F. & Castro, F. A. de S. (2023). Anthropometry, Tactical Position, Performance Parameters and Experience in Water Polo: Network Analysis. Apunts Educación Física y Deportes, 152, 62-69. https://doi.org/10.5672/apunts.2014-0983.es.(2023/2).152.07
Abstract
This study aimed to verify, in water polo (WP), the networks formed with anthropometry, tactical position of the players, and performance in WP specific tests, by experience in the modality. It was aimed, as well, to comparing the variables of the net between the less (group 1 – G1, 24 players) and more (group 2 – G2, 25 players) experienced players. The study included WP players from four teams. Body mass, height, and arm span were measured and tests for agility (AGIL), vertical jump (VJ) and throw speed (TS) were applied. Comparison between groups was performed with Student’s t test for independent data and the effects size were verified with Cohen’s d. Three measures of centrality, in z-score, were used: expected influence (EI), closeness centrality (CC), and strength centrality (SC). Network figures demonstrated the relationships between variables in each group. Experience effect sizes were moderated for body mass and for VJ. Arm span and experience had the highest EI values (1.70 and 1.32, respectively), which indicates that the variables are most susceptible to interventions. For G1, tactical position and VJ presented the highest values of CC (1.23 and 1.75, respectively), which indicates that the variables are most quickly affected by interventions, and SC (1.14 and 0.77, respectively), which indicates they have the strongest relationships in the system. For G2, height and arm span had the highest EI values (1.05 and 0.91, respectively). Arm span and body mass had the highest CC values (1.57 and 0.91, respectively). Arm span and experience had the highest SC values (2.16 and 0.69, respectively). G2 formed a more stable network and fewer relationships than G1 players. In general, G1 had a more complex network and G2 a less complex network between variables; anthropometry and experience influence (i) the performance of the WP player to perform specific actions (agility, jumping and throwing) and (ii) the definition of the player’s tactical position in the team.
Introduction
Water polo (WP) is a team and invasion sport, whose main objective is to invade the sector defended by the opponent, reaching the opposite goal to score and protect, simultaneously, the own goal. Because it is practiced in water, the environment presents uncertainties to practitioners; therefore, it should require permanent motor adaptation (Lamas et al., 2014). Specific and vast skills are required, so the requirements go beyond classic swimming techniques, i.e., the four swimming strokes. It is essential to acquire an extended motor repertoire that includes changes in the direction and rhythm, accelerations, braking, jumping, rotations, eggbeater, and ball handling (Canossa et al., 2009). These skills, which are expressed in a complex way in tasks related to agility, shooting, blocking, and passing, are also crucial to the game tactics.
Anthropometric characteristics present important correlations with specific actions of WP, such as throwing speed, for example, and indicate characteristics that must be considered when determining the different tactical positions of players, as center offensives are commonly higher and heavier than wings, for example (Idrizović et al., 2013). The time of experience exerts an important influence on the performance in WP, in relation to the mastery of the aquatic environment, the perception of competence and the mastery of technical-tactical fundamentals (Iturriaga, 2015). In this way, the initiation in WP, in the most traditional countries, takes place before the age of 10, and in the main international competitions the teams have players with an average age over 25 years old (Canossa et al., 2009).
In sport in general, performance parameters can be evaluated in specific tests (Platanou, 2005). The evaluation is important to control training and performance and by systematically evaluating it is possible to predict individual and collective performance (Quevedo et al., 2015; Menescardi et al., 2019), which will result in valuable information for coaches and athletes (Canossa et al., 2009). Often in WP, tests are applied empirically or in some cases of unclear relevance; therefore, tests that can assess specific motor skills individually, and in combination, are needed (Veale et al., 2010). Agility, throw speed, and vertical jump are considered the main abilities that determine the success of a WP player, as previously reported (Alcaraz et al., 2011; Platanou, 2005). Those tests present, as main objectives, respectively, to evaluate the agility (AGIL) of the line players, the throwing speed (TS), and the vertical jump (VJ) with the execution of the propulsive eggbeater kick.
Bivariate correlation analyses predominate in the investigation of the relationships between performance parameters in WP (De Castro et al., 2021). However, their results often do not point to theoretically expected correlations. Thus, such analyses do not seem to show the best picture of the relationships between the various variables that influence performance. In this case, a possibility of study is the analysis of networks, which allows exploring performance parameters individually, collectively and their interactions (Lusher et al., 2010). In this perspective, players and evaluated characteristics can be seen as network nodes connected through performance-relevant variables, sustaining complex patterns of interaction between teammates. In this way, it becomes possible to obtain detailed information on all analyzed variables (Ribeiro et al., 2017), without excluding them from the analyses. In sports performance, small contributions of variables to performance can modify the entire network and change performance. In this way, it is possible to identify which variables are most influential for changes from interventions. Considering the complexity of WP, three measures of centrality were selected for this study: (i) the Expected Influence (IE) indicates the variables most susceptible to intervention, as well as indicating which variables are more difficult to access, those more resistant to change; (ii) the Closeness Centrality (CC) indicates which variables have the shortest path among the others, that is, which variables could be affected by interventions more quickly, and (iii) the Strength Centrality indicates which variables, in the current pattern of the network, have the strongest relationships.
Considering (i) the broader possibilities of analyzing networks in sport, (ii) the need of understanding the possible relationships among different parameters that influence performance in WP, and (iii) the possible effect of practical experience on performance, the goals of this study were: to verify the networks formed with anthropometry, tactical position of the players, and performance in specific tests, by experience in the modality, as well as to compare the variables of the network between the more and less experienced players.
Methodology
Forty-nine male WP players, from four different teams, participated in this study. They were divided into two groups by the 50th percentile of experience (years) in WP training championships. The tactical positions were identified by the performance of athletes in games and training, so they were classified as central positions (center back and center offensive) and peripheral positions (wings and flats). Group I (less experienced, G1) consisted of 24 players (3 center players and 21 peripheral players). Group 2 (more experienced, G2) consisted of 25 players (6 center players and 19 peripheral players). Participants trained at least three times a week, between 90 and 120 min per session, in the last 6 months prior to collection, and used to participate in regional and national championships. Table 1 shows the frequencies (absolute/relative) of the tactical game positions of the participants in each group.

Table 1
Absolute (and relative) frequency of the preferred positions of the participants in each group (G1: less experienced; G2 more experienced).
This research was evaluated and approved by the Local Research Ethics Committee (36758920.3.0000.5347). Participants over 18 years old and parents or guardians of participants under 18 years old signed a consent form and participants under 18 signed a consent form to participate in the study.
Data collection and analysis
Anthropometric data and information regarding experience and tactical position were obtained before testing in the pool. The athletes were instructed not to train 24 hours before the tests. In addition, they were asked to avoid, 72 hours before the tests, consuming any product with caffeine or alcohol. Height, body mass and arm span were obtained using standard procedures, with a measuring tape and scale, and players were barefoot and wearing only swimming suits. The tests were applied over three days, separated by at least 24 hours, always with a standard warm-up for the WP training session.
Tests
Agility
To obtain AGIL data, the Functional Test for Agility Performance (FTAP) was applied (Tucher et al., 2014, 2015, 2016). The players followed the trajectory of the ball after passes made by the players positioned at the vertices of the area established for the test (9 m²). At each vertex, a ball was placed in a floating arch. Three passes were performed between players positioned at the vertices. The assessed players knew only the direction of the first pass executed, thus, for the second and third pass, a quick displacement was necessary for the removal of the ball from the arc of the respective player from the vertex that received and executed the next pass. After the second ball was removed, the timer was stopped, and the agility time recorded. Two stopwatches (Casio, JS-9006P, Japan) were used by two experienced trainers. The evaluators and test players were informed in advance about the test procedures and were properly familiarized with the protocol. To avoid interfering with test performance, athletes did not receive information about the result during the FTAP application.
Throw speed
The test was adapted from the one proposed by Vila et al. (2009). A 5-minute warm-up was given to the participants, who performed passes and throws. The evaluated players threw to the goal at 5 m, simulating a penalty kick, without the goalkeeper. In the test, each athlete evaluated performed five shots with 1 min interval between attempts. In situations where the ball went out, bounced in the water before reaching the goal, or hit the post, it was necessary to repeat the attempt. A radar (26.5-40 gHz; Bushnell, United States) located behind the goal was used to measure the speed of the ball after the throw, as described by Skoufas et al. (2003).
Vertical jump
The players remained in a vertical position performing eggbeater and sculling with one hand, while the other arm remained extended above the headline (defensive position for blocking) for 5 s, in an area whose height was previously calibrated at 200 cm (further transformation of pixels into cm). After that, they sculled with both hands and prepared to execute the vertical jump as high as possible, performing a high-intensity leg movement and touching with one hand (dominant arm) the plate as much as possible (De Castro et al., 2021; Platanou, 2006). Each player performed three attempts at a 5 min interval. A video camera (60 Hz; VPC-WH1, Sanyo, Japan) was used on a tripod. The images of the tests were analyzed in the Kinovea open-source software (www.kinovea.org) and the result of the vertical jump in centimeters was obtained.
Statistical analysis
Data normality was verified with the Shapiro-Wilk test. Means, standard deviations, and means confidence limits (95%) were calculated for the scalar variables. Absolute and relative frequencies were calculated for categorical variables. Comparison of scalar variables, between G1 and G2, was performed using Student’s t test for independent data (alfa ≤ .05). Effect size of experience (group effect) on scalar variables were verified with Cohen’s d and categorized according to: 0 to 0.19, trivial; 0.2 to 0.59, small; 0.6 to 1.19, moderate; 1.2 to 1.99, large; 2.0 to 3.99, very large, and > 4.0 almost perfect (Hopkins, Will G., 2002).
To verify the possible associations among anthropometry, tactical position and tests performances, the Machine Learning Technique called Network Analysis was applied. Centrality measures were generated and transformed into z-scores to understand the role of each variable in the system. In the present study, three measures were used (Epskamp et al., 2012):
- (i) Expected influence (EI): estimated from the magnitude of the negative and positive edges that connect one node to the others.
- (ii) Closeness centrality (CC): determined from the inverse of the distances from one node to all others.
- (iii) Strength centrality (SC): the sum of all the weights of the paths connecting one node to the others.
Regarding centrality measures, the farther from zero, the greater the relevance of the variable within the system. In this study, the “pairwise Markov” random field model was used to improve the accuracy of the partial correlation network. The estimation algorithm used assumes the highest order interaction of the true graph. The algorithm includes an L1 (regularized neighborhood regression) penalty. Regularization is achieved by a least absolute selection and contraction operator (LASSO) that controls the model’s dispersion (Friedman et al., 2008). The Bayesian Extended Information Criterion (EBIC) was used because it is more conservative to select Lambda from the regularization parameter. EBIC uses a hyperparameter (y) that determines how much EBIC selects sparse models (Chen, 2008; Foygel & Drton, 2011). The y value is usually set between 0 and 0.5. Higher values indicate more parsimonious models with fewer edges. A value closer to 0 indicates an estimate with more edges. A y value of 0.25 is potentially a useful value for exploratory networks. This value was used in the present study (Foygel & Drton, 2011). The LASSO regularized algorithms to obtain the precision matrix, which, when standardized, represents the associations between the network variables. The positive relationships in the network are expressed by green and the negative ones by the red color. The thickness and intensity of the colors represent the magnitude of the associations. The SPSS v.20.0 and version 0.14.1.0 programs were used for the analysis and construction of the networks.
Results
Descriptions and comparisons of time of experience, age, anthropometric characteristics, and performance parameters, as well as the experience effect sizes are in Table 2. Time of experience presented: (i) large effect size on age, (ii) trivial on height and arm span, and (iii) moderate on body mass. Regarding performance parameters, the effects of the experience groups were: (i) moderate on vertical jump and (ii) small on agility ball and throw speed. G2 were older, had more experience, were heavier, and reached higher VJ than G1.
Table 2
Means, standard deviations, means confidence limits (95%), comparisons and Cohen’s d and respective category of effect of groups for experience time, age, anthropometric characteristics, and performance parameters (G1: less experienced; G2 more experienced).
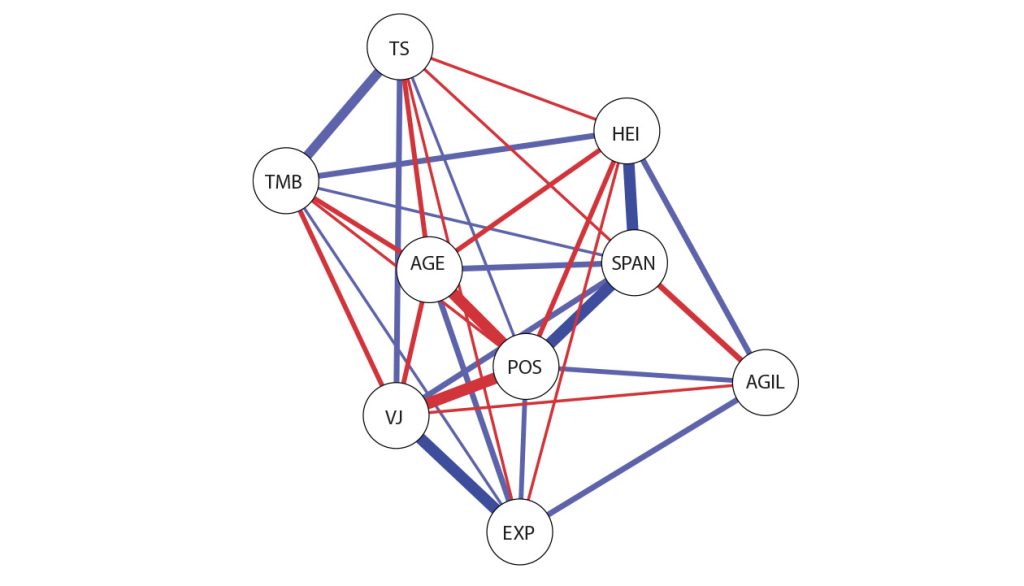
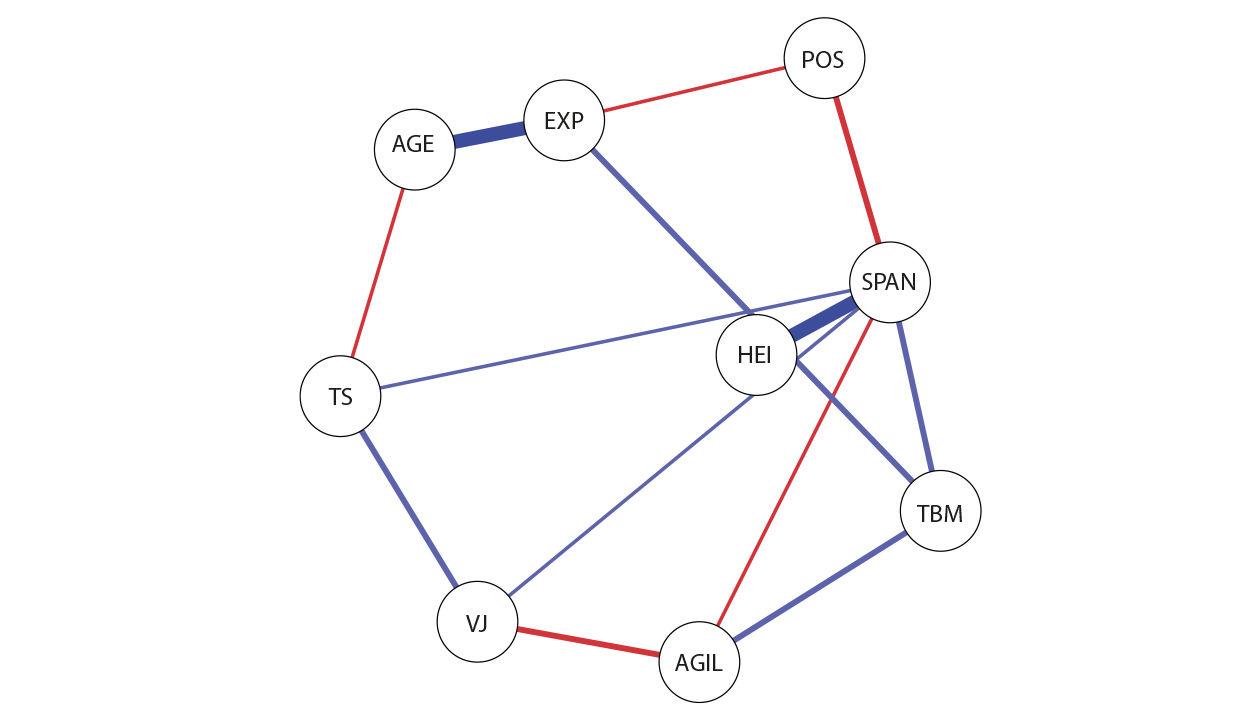
Figures 1 and 2 show the networks formed for, respectively, G1 and G2 using the variables experience (EXP), age (AGE), height (HEI), arm span (SPAN), total body mass (TBM), tactical position (POS), vertical jump (VJ), agility (AGIL), and throw speed (TS). Blue lines indicate positive relationships, reddish lines indicate negative relationships. The thickness of each line indicates the relation strength.1
The centrality measures, for G1 and G2, in relation to tactical position, experience, age, height, arm span, total body mass, VJ, AGIL, and TS are shown in Table 3.
Table 3
Centrality measures for G1 (less experienced; n = 24) and G2 (more experienced; n = 25).
Discussion
This study verified the networks formed among anthropometry, tactical position of players, and performance in WP specific tests by experience in the modality, as well as compared the variables of the network between the more and less experienced groups. Among the results of this study, the ones that stand out are: (i) the graphical analysis of the networks illustrated the greater connectivity of the variables for G1 and indicated a lower level of complexity between the variables for G2; and (ii) the influence of EXP on anthropometry and performance parameters indicated in moderate effect sizes for body mass and VJ, respectively. When compared, G2 had higher values for age, total body mass, and VJ than G1.
To reach a good technical level in WP, it is required at least 15 years of competitive experience. This statement is based on the analysis that the best international teams have players with an average age over 25 and initiation in WP, in the most traditional and winner countries, occurs even before the age of 10 (Canossa et al., 2009). So, experience exerts a preponderant influence on performance in the modality. In this study, we could find just moderate experience effect size in total body mass and in VJ. Yet, regarding the interpretation of the effect size (Cohen, 1988) indicated that a moderate effect size represents a magnitude evident to the naked eye to a careful investigator; in this way, somehow the influence on the observed variable must be considered (Espírito Santo & Daniel, 2017). The VJ presents itself as a decisive parameter for the outstanding performance in WP, as it influences the ability to execute passes, offensive throws, and blocks (Platanou, 2005). In this case, experience indicates that it is relevant to such a capability.
Different studies seek to investigate factors that may influence performance in WP with correlation analysis. For example, in the study by De Castro et al. (2021) three performance parameters were analyzed in Brazilian WP players: AGIL, VJ, and TS. The results indicated a positive correlation of AGIL with VJ and TS. However, it was not possible to identify a pattern for the best athletes in the three variables analyzed together. In the study by Zinner et al. (2015), with German national team players, the performance in the execution of the eggbeater, isometric and dynamic strength tests, and WP specific tests were assessed. Positive correlations were observed for muscle strength for high performance in eggbeater execution, with consequences for greater speed in the throw.
Sports games, teams, and athletes have recently been seen as complex adaptive systems whose behavior is influenced by environmental, individual, and task constraints (Pol et al., 2020). From this perspective, WP can be understood as a complex phenomenon as it contains variables of different natures that influence performance: anthropometric, tactics, techniques. Thus, they must be sensitive to changes and exhibit behaviors that are not linear. To interpret the different variables in relation to performance in WP, network analysis seems to best translate these interactions, that is, in an integrated way, to be able to observe all the relationships that may influence behavior for different levels of performance.
In this study, through the graphic analysis of the networks, it was possible to identify the relationships between the variables in each experience group. Furthermore, differences between groups were identified: the first one concerns the network pattern presented for the group of less experienced athletes (G1) compared to the group of more experienced athletes (G2). Figure 1 indicates a network with a higher level of complexity (G1), with close and multiple interactions, a scenario that suggests that athletes with less experience have a greater number of variables sensitive to changes. Figure 2, on the other hand, indicates a network with a distinct pattern for more experienced athletes (G2), with greater distance between the performance variables, which seem to be more fixed. Consequently, they seem to be more resistant to change. Such results, considering the possible responses of young players to training, seem to reinforce the possibility that experience plays an important role, especially when it comes to provide countless and diverse practices in young athletes.
The EI values, regarding the performance parameters, indicate that, for G2, AGIL (-0.08) is the most difficult variable to be accessed and with the least capacity to undergo direct interventions. In G1 it was possible to identify the importance of experience for all variables in the network (1.32). Regarding the anthropometric parameters, for G2 the main variables were arm span (1.05) and height (0.91). For G1, the highlighted variable indicated was the arm span (1.70). As for the CC, considering the performance parameters, the values indicate that for G1, the VJ (1.14) is the closest variable to the other in the network. Consequently, from a possible intervention, VJ can take effect quickly. Regarding the tactical position, G1 and G2 presented, respectively, 1.23 and 0.56. The values suggest that for G1 the tactical position is more sensitive to changes. Such result may indicate the low specialty of action in relation to the role that less experienced players should have. As for the anthropometric parameters, the highlight is the value presented for arm span (1.57) and body mass (0.91) in G2. The SC values, in the performance parameters, indicate that for G1, VJ (0.77) has more strong relationships in the current network standard. In relation to the tactical position, G1 and G2 presented, respectively, 1.75 and -0.40. For experience, there was also a difference between the groups. G1 and G2 presented, respectively, -0.43 and 0.69. Regarding the anthropometric parameters, the highlight is the value presented for the span (2.16) in G2. This result indicates the magnitude of the relationships between the span and the other variables. Thus, anthropometric parameters can be considered essential for coaches to determine the tactical positions of their athletes on their teams.
The integrated analysis with several variables, seeking to verify the complex relationship of different parameters that can influence performance in WP, is only possible with analyses such as the one used in this study. In WP, earlier, isolated relationships between anthropometric parameters and performance have already been demonstrated (Platanou & Varamenti, 2011) and with performance parameters (De Castro et al., 2021), for example. However, such analyses are limited to the elimination of joint analysis of selected parameters that could, in some way, interfere in performance. The results of the present study, in an initial way, allow this analysis to be made based on the complexity of the modality. Although, it is possible to indicate some limitations of the present study: the participation of a small number of players who have a central position, the lack of more specific anthropometric analyses, and the lack of analyses carried out in game situations.
Conclusion
Through network analysis, it was possible to visualize the level of complexity and magnitude of interactions between anthropometric and performance variables in WP for groups with different years of experience. For the less experienced group (G1), the greater intensity between the relationships (i.e., the formation of a more complex network with greater connectivity between nodes), indicated that players in training have more variables sensitive to interventions and changes than more experienced players. For the more experienced (G2), the less connectivity between nodes (less complexity), indicated more fixed and resistant variables to changes. In general, anthropometry and experience influence (i) the performance of the WP player to perform specific actions (agility, jumping and throwing) and (ii) the definition of the player’s tactical position in the team.
References
[1] Alcaraz, P. E., Abraldes, J. A., Ferragut, C., Rodriguez, N., Argudo, F. M., & Vila, H. (2011). Throwing velocities, anthropometric characteristics, and efficacy indices of women’s european water polo subchampions. Journal of Strength and Conditioning Research, 25(11), 3051–3058. https://doi.org/10.1519/JSC.0b013e318212e20f
[2] Argudo Iturriaga, F. M., de la Vega Marcos, R., & Ruiz Barquín, R. (2015). Perception of Success and Athletic Performance of a Water Polo Goalkeeper. Apunts Educación Física y Deportes, 122, 21-27. https://doi.org/10.5672/apunts.2014-0983.es.(2015/4).122.02
[3] Canossa, S., Garganta, J., & Fernandes, R. (2009). Pólo Aquático: Conteúdos de Ensino e Princípios do Jogo – Water Polo: The Teaching Contents and the Game Principles. In Argudo FM (ed). Investigación en waterpolo (2004-2009) (pp. 7-22). Madrid: Editorial Azarbe.
[4] Chen, W. C. (2008). Nonlinear dynamics and chaos in a fractional-order financial system. Chaos, Solitons and Fractals, 36(5), 1305–1314. https://doi.org/10.1016/j.chaos.2006.07.051
[5] Cohen (1988) Statistical Power for the behavioural science, 273-406. New York: Lawrence Erlbaum Associates.
[6] De Castro, C. D., Tucher, G., Paixão, D. A., Vasques, D. M., Garrido, N. D., & de Souza Castro, F. A. (2021). Agility, vertical jump, and shot velocity of Brazilian water polo players: correlations and top performances analysis. The Journal of Sports Medicine and Physical Fitness. https://doi.org/10.23736/S0022-4707.21.12318-7
[7] Epskamp, S., Cramer, A. O., Waldorp, L. J., Schmittmann, V. D., & Borsboom, D. (2012). qgraph: Network Visualizations of Relationships in Psychometric Data. Journal of Statistical Software, 48(4), 1–18. https://doi.org/10.18637/jss.v048.i04
[8] Espírito Santo, H., & Daniel, F. (2017). Calcular e apresentar tamanhos do efeito em trabalhos científicos (2): Guia para reportar a força das relações. Revista Portuguesa de Investigação Comportamental e Social, 3(1), 53–64. https://doi.org/10.7342/ismt.rpics.2017.3.1.48
[9] Foygel, R., & Drton, M. (2011). Bayesian model choice and information criteria in sparse generalized linear models. 1–37. https://doi.org/10.48550/arXiv.1112.5635
[10] Friedman, J., Hastie, T., & Tibshirani, R. (2008). Sparse inverse covariance estimation with the graphical lasso. Biostatistics, 9(3), 432–441. https://doi.org/10.1093/biostatistics/kxm045
[11] Hopkins, Will G. “A scale of magnitudes for effect statistics.” A new view of statistics 502 (2002): 411. (n.d.). Retrieved February 9, 2022, from https://scholar.google.com.br/scholar?hl=pt-BR&as_sdt=0%2C5&q=Hopkins.+W.+G.+%282002%29.+A+scale+of+magnitudes+for+effect+statistics.+A+new+view+of+statistics+%5BInternet%5D.+2002.%5BAccess+Sept+26.+2016%5D.&btnG=
[12] Idrizović, K., Uljević, O., Ban, D., Spasić, M., & Rausavljević, N. (2013). Sport-specific and anthropometric factors of quality in junior male water polo players. Coll Antropol. 2013 Dec;37(4):1261-6. https://pubmed.ncbi.nlm.nih.gov/24611343/
[13] Lamas, L., Barrera, J., Otranto, G., & Ugrinowitsch, C. (2014). Invasion team sports: Strategy and match modeling. International Journal of Performance Analysis in Sport, 14(1), 307–329. https://doi.org/10.1080/24748668.2014.11868723
[14] Lusher, D., Robins, G., & Kremer, P. (2010). The application of social network analysis to team sports. Measurement in Physical Education and Exercise Science, 14(4), 211–224. https://doi.org/10.1080/1091367X.2010.495559
[15] Menescardi, C., Estevan, I., & Hernández, A. M. (2019). Estudio observacional en water polo olímpico. Apunts Educación Física y Deportes, 136, 100-112. http://dx.doi.org/10.5672/apunts.2014-0983.es.(2019/2).136.07
[16] Platanou, T. (2005). On-water and dryland vertical jump in water polo players. Journal of Sports Medicine and Physical Fitness 2005 Mar;45(1):26-31. https://www.researchgate.net/publication/7557820
[17] Platanou, T. (2006). Simple ‘ in-water ’ vertical jump testing in water polo. Kinesiology, 38(1), 57–62.
[18] Platanou, T., & Varamenti, E. (2011). Relationships between anthropometric and physiological characteristics with throwing velocity and on water jump of female water polo players. Journal of Sports Medicine and Physical Fitness 51(2), 185–193.
[19] Pol, R., Balagué, N., Ric, A., Torrents, C., Kiely, J., & Hristovski, R. (2020). Training or Synergizing? Complex Systems Principles Change the Understanding of Sport Processes. Sports Medicine - Open, 6(1). https://doi.org/10.1186/s40798-020-00256-9
[20] Quevedo, L. J., Padróes, A. B., Solé, J. i., & Cardona, G. T. (2015). Entrenamiento perceptivo cognitivo con el neurotracker 3D-MOT para potenciar el rendimiento en tres modalidades deportivas. Apunts. Educación Física y Deportes, 119, 97-108. https://doi.org/10.5672/apunts.2014-0983.es.(2015/1).119.07
[21] Ribeiro, J., Silva, P., Duarte, R., Davids, K., & Garganta, J. (2017). Team Sports Performance Analysed Through the Lens of Social Network Theory: Implications for Research and Practice. Sports Medicine, 47(9), 1689–1696. https://doi.org/10.1007/s40279-017-0695-1
[22] Skoufas, D., Stefanidis, P., Michailidis, C., Hatzikotoulas, K., Kotzamanidou, M., & Bassa, E. (2003). The effect of handball training with underweighted balls on the throwing velocity of novice handball players. Journal of Human Movement Studies, 44(2), 157–171.
[23] Tucher, G., Castro, F. A. de S., da Silva, A. J. R. M., & Garrido, N. D. (2016). Sensitivity and validity of a functional test for agility performance in water polo players. Kinesiology 48(1): 124-131. https://doi.org/10.26582/k.48.1.3
[24] Tucher, G., De Souza Castro, F. A., Da Silva, A. J. R. M., & Garrido, N. D. (2015). The functional test for agility performance is a reliable quick decision-making test for skilled water polo players. Journal of Human Kinetics, 46(1), 157–165. https://doi.org/10.1515/hukin-2015-0044
[25] Tucher, G., De Souza Castro, F. A., Garrido, N. D., & Da Silva, A. J. R. M. (2014). The reliability of a functional agility test for water polo. Journal of Human Kinetics, 41(1), 181–190. https://doi.org/10.2478/hukin-2014-0046
[26] Veale, J. P., Pearce, A. J., & Carlson, J. S. (2010). Reliability and validity of a reactive agility test for australian football. International Journal of Sports Physiology and Performance, 5(2), 239–248. https://doi.org/10.1123/ijspp.5.2.239
[27] Vila, H., Ferragut, C., Argudo, F. M., Abraldes, J. A., Rodríguez, N., & Alacid, F. (2009). Relationship between anthropometric parameters and throwing velocity in water polo players. Journal of Human Sport and Exercise, 4(1), 57–68. https://doi.org/10.4100/jhse.2009.41.07
[28] Zinner, C., Sperlich, B., Krueger, M., Focke, T., Reed, J., & Mester, J. (2015). Strength, endurance, throwing velocity and in-water jump performance of elite German water polo players. Journal of Human Kinetics, 45(1), 149–156. https://doi.org/10.1515/hukin-2015-0015
ISSN: 2014-0983
Received: 4 de julio de 2022
Accepted: 18 de noviembre de 2022
Published: 1 de abril de 2023
Editor: © Generalitat de Catalunya Departament de la Presidència Institut Nacional d’Educació Física de Catalunya (INEFC)
© Copyright Generalitat de Catalunya (INEFC). This article is available from url https://www.revista-apunts.com/. This work is licensed under a Creative Commons Attribution-NonCommercial-NoDerivatives 4.0 International License. The images or other third party material in this article are included in the article’s Creative Commons license, unless indicated otherwise in the credit line; if the material is not included under the Creative Commons license, users will need to obtain permission from the license holder to reproduce the material. To view a copy of this license, visit https://creativecommons.org/licenses/by-nc-nd/4.0/deed.en


